Your Title Goes Here
Country Flag Details
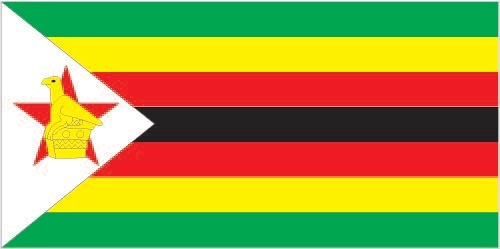
seven equal horizontal bands of green (top), yellow, red, black, red, yellow, and green with a white isosceles triangle edged in black with its base on the hoist side; a yellow Zimbabwe bird representing the long history of the country is superimposed on a red five-pointed star in the center of the triangle, which symbolizes peace; green represents agriculture, yellow mineral wealth, red the blood shed to achieve independence, and black stands for the native people.
Background
The Kingdom of Zimbabwe was the largest trading state in the area until the mid-15th century. UK colonization in the late 1800s led to the creation of Southern Rhodesia in 1923. UN sanctions and an uprising led to free elections in 1979 and the creation of an independent country of Zimbabwe in 1980.
Your Title Goes Here
Area
total : 390,757 sq km
land: 386,847 sq km
water: 3,910 sq km
Climate
tropical; moderated by altitude; rainy season (November to March)
Natural resources
coal, chromium ore, asbestos, gold, nickel, copper, iron ore, vanadium, lithium, tin, platinum group metals
People and Society
Population
total: 17,150,352
Ethnic groups
African 99.6% (predominantly Shona; Ndebele is the second largest ethnic group), other (includes Caucasian, Asiatic, mixed race) 0.4% (2022 est.)
Languages
Shona (official, most widely spoken) 80.9%, Ndebele (official, second most widely spoken) 11.5%, English (official, traditionally used for official business) 0.3%, 13 minority languages (official; includes Chewa, Chibarwe, Kalanga, Koisan, Nambya, Ndau, Shangani, sign language, Sotho, Tonga, Tswana, Venda, and Xhosa) 7%, other 0.3% (2022 est.)
Religions
Apostolic Sect 40.3%, Pentecostal 17%, Protestant 13.8%, other Christian 7.8%, Roman Catholic 6.4%, African traditionalist 5%, other 1.5% (includes Muslim, Jewish, Hindu), none 8.3% (2022 est.)
Population growth rate
1.91% (2024 est.)
Government
Government type
presidential republic
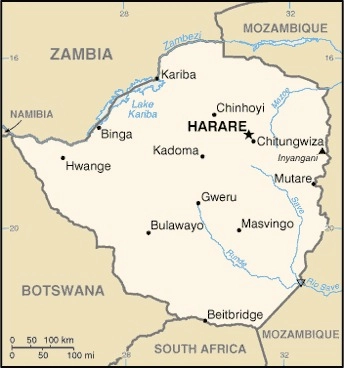
Capital name: Harare
Executive branch
chief of state: President Emmerson Dambudzo MNANGAGWA (since 4 September 2023)
head of government: Vice President Constantino CHIWENGA (since 11 September 2023)
Economy
Economic overview
low income Sub-Saharan economy; political instability and endemic corruption have prevented reforms and stalled debt restructuring; new Zimbabwe Gold (ZiG) currency latest effort to combat ongoing hyperinflation; reliant on natural resource extraction, agriculture and remittances
Real GDP (purchasing power parity)
$56.249 billion (2023 est.)
$53.399 billion (2022 est.)
$50.311 billion (2021 est.)
Real GDP per capita
$3,400 (2023 est.)
$3,300 (2022 est.)
$3,200 (2021 est.)
Exports
$7.603 billion (2023 est.)
$7.453 billion (2022 est.)
$6.575 billion (2021 est.)
Exports – partners
UAE 45%, China 18%, South Africa 15%, Mozambique 4%, Hong Kong 2% (2023)
Exports – commodities
gold, tobacco, nickel, minerals, diamonds (2023)
Imports
$10.293 billion (2023 est.)
$9.569 billion (2022 est.)
$8.104 billion (2021 est.)
Imports – partners
South Africa 37%, China 15%, Bahamas, The 5%, Singapore 5%, UAE 4% (2023)
Imports – commodities
refined petroleum, fertilizers, trucks, soybean oil, stone processing machines (2023)
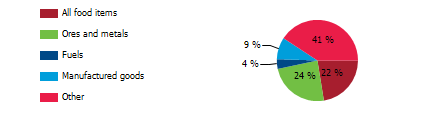
Explore structure by product group in 2023 (% of total exports) (UNCTAD)
The export structure of a nation is indicative of the diversity, composition, and monetary value of goods and services exchanged on the global stage, thereby providing essential insights into the economic robustness, competitive standing, and developmental phase of that nation. In the case of Zimbabwe, the export framework is predominantly reliant on its mineral wealth, particularly gold and nickel, alongside significant contributions from agricultural exports such as tobacco. Although these sectors generate considerable fiscal inflows, the economy’s heavy dependence on a limited array of export commodities highlights an urgent imperative for diversification to alleviate vulnerabilities linked to fluctuations in global commodity prices.
Poverty and vulnerable employment in Zimbabwe
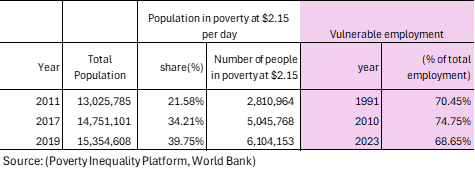
In 2023, a concerning 69 percent of Zimbabwe’s total employment was classified as vulnerable employment, highlighting the struggles faced by many in the workforce. Vulnerable employment signifies a reality where individuals encounter inadequate job security, low wages, and a glaring absence of essential social protections such as health insurance, pensions, or labor rights. This situation primarily affects Own-Account Workers—those who labor for themselves without employees, like street vendors and small-scale farmers—as well as Contributing Family Workers who support family businesses or farms without receiving formal payment. These roles often exist in informal and unstable environments, leading to a profound lack of benefits, which leaves workers particularly vulnerable to economic shocks, exploitation, and the harsh realities of poverty. The repercussions of such employment ripple outward, affecting not just individuals but also their families and communities, perpetuating cycles of instability and hardship that can feel insurmountable.
Understanding poverty level significance at $2.15 per day
In 2019, 40 percent of the population in Zimbabwe ( about 6 million people) lived in poverty at $2.15 per day. The poverty level at $2.15 per day (measured in 2017 purchasing power parity, or PPP) is a key global benchmark used by the World Bank to define extreme poverty in low-income countries. It indicates:
1. Basic Survival Threshold
• People living below $2.15 per day struggle to afford essential needs such as food, clean water, shelter, healthcare, and education.
2. Economic Underdevelopment
• A high percentage of a country’s population living below this threshold suggests low economic productivity, high unemployment, and weak social safety nets.
3. Inequality and Social Vulnerability
• It reflects deep income inequality and a lack of access to opportunities for upward mobility.
• People in this category are more vulnerable to shocks like food price increases, climate disasters, or health crises.
4. Policy Challenges
• Governments need targeted interventions such as social welfare programs, job creation, and improved access to education and healthcare to reduce poverty.
A country's export structure is a reflection of its level of development and productive capacities
The export structure of a country refers to the composition, diversity, and value of the goods and services it sells to other countries. It provides key insights into the country’s economic health, competitiveness, and level of development. Productive capacities of a country refer to its ability to produce goods and services efficiently and sustainably over time. These capacities are shaped by various factors, including human capital, natural resources, infrastructure, private sector, development, technology & innovation, institutions & governance, financial systems trade & market access.
Here’s what the export structure and productive capacities of a country typically indicate:
- Level of Economic Development
- Developed economies usually export high-value manufactured goods, technology, and services.
- Developing economies often rely on raw materials, agricultural products, or low-value manufactured goods.
- Industrial and Sectoral Strengths
- A strong presence of high-tech or industrial goods (e.g., machinery, electronics) suggests a well-developed manufacturing sector.
- A dominance of commodities (e.g., oil, minerals, agricultural products) indicates reliance on natural resources.
- Export Diversification
- A diverse export base (multiple industries) makes a country’s economy more stable and resilient to global price shocks.
- A concentrated export base (few key products) makes it vulnerable to market fluctuations.
- Trade Partnerships and Dependence
- If exports are heavily dependent on a single country or region, the economy is more exposed to geopolitical and trade risks.
- A wide range of trading partners indicates stronger global integration.
- Competitiveness and Value Addition
- Exporting mainly raw materials (e.g., crude oil instead of refined petroleum) suggests limited industrial processing capacity.
- A high share of finished and high-tech goods suggests strong value addition and competitiveness.
Zimbabwe-Sanitation
Zimbabwe – Proportion of population served with at least basic sanitation
In 2022, the proportion of the population served with at least basic sanitation in Zimbabwe was 34.6%. The proportion of the population served with at least basic sanitation in Zimbabwe declined gradually from 44.5 % in 2000 to 34.6 % in 2022, an absolute change of 9.9 percentage points(pp) decrease between 2000 and 2022.
Zimbabwe – Proportion of urban population served with at least basic sanitation
In 2022, the proportion of the urban population served with at least basic sanitation in Zimbabwe was 40.4%. The proportion of urban population served with at least basic sanitation in Zimbabwe declined gradually from 63.1 % in 2000 to 40.4 % in 2022, an absolute change of 22.7 pp decrease between 2000 and 2022.
Zimbabwe – Proportion of rural population served with at least basic sanitation
In 2022, the proportion of the rural population served with at least basic sanitation in Zimbabwe was 31.8 %. Proportion of rural population served with at least basic sanitation gradually declined from 35.0 % in 2000 to 31.8 % in 2022, an absolute change of 3.2 pp decrease between 2000 and 2022.
Zimbabwe – Proportion of population served with at least basic sanitation: A Global Perspective
The ongoing lack of safe sanitation is a critical challenge that demands our united action to prevent unnecessary deaths and address a major public health crisis. Safe sanitation is a fundamental human right that must be accessible to everyone. In 2022, around 11 million people, nearly 65 percent of Zimbabwe’s population, faced severe consequences due to inadequate sanitation, contrasting sharply with Vietnam, China, and Thailand, where only 8 percent, 5 percent, and 1 percent lacked these services. With 6 percent of the global population still without proper sanitation, it is essential for us to work together to improve sanitation issues for marginalized communities in Sub-Saharan Africa, ensuring all individuals can enjoy the dignity and well-being that come from access to adequate sanitation.

Zimbabwe – Proportion of rural population served with at least basic sanitation: A Global Perspective
In 2022, nearly 7.6 million people in rural Zimbabwe, about 68 percent of the population, lacked access to basic sanitation facilities, starkly contrasting with countries like Vietnam, Sri Lanka, and Thailand, where those figures are significantly lower at 12 percent, 5 percent, and 2 percent respectively. This absence of safe sanitation is a profound concern that demands our immediate attention, as it contributes to the tragic loss of many lives each year and worsens a public health crisis requiring our compassionate response. Safe sanitation is a fundamental human right that everyone deserves, and we must unite to advocate for this right across Sub-Saharan Africa, where the need is urgent and the potential for meaningful community improvements is essential for upholding human dignity and well-being.

Zimbabwe-Water Supply
Zimbabwe – Proportion of total population served with at least basic water
In 2022, the proportion of the population served with at least basic water in Zimbabwe was 62.3 %. The proportion of the population served with at least basic water in Zimbabwe declined gradually from 71.8 % in 2000 to 62.3 % in 2022, an absolute change of 9.5 pp decrease between 2000 and 2022.
Zimbabwe- Proportion of urban population served with at least basic water
In 2022, the proportion of the urban population served with at least basic water in Zimbabwe was 92.8 %. The proportion of urban population served with at least basic water in Zimbabwe declined from 95.4% in 2000 to 92.7% in 2022, an absolute change of 2.6 pp decrease between 2000 and 2022.
Zimbabwe – Proportion of rural population with at least basic water
In 2022, the proportion of the rural population served with at least basic water in Zimbabwe was 47.7 %. The proportion of the rural population served with at least basic water in Zimbabwe gradually declined from 59.8 % in 2000 to 47.7 % in 2022, an absolute change of 12.1 pp decrease between 2000 and 2022.
Zimbabwe – Proportion of population population served with at least basic drinking water: A Global Perspective
Access to safe drinking water is a fundamental human right and a vital necessity, yet in 2022, around 6 million people in Zimbabwe, or about 38 percent of the population, lacked this essential resource, revealing a dire public health crisis that requires urgent action. In contrast, every individual in Thailand and 98 percent of people in Vietnam and Bangladesh had reliable access to safe drinking water that same year. This stark disparity highlights the critical need for reforms in Sub-Saharan Africa, the only developing region where many still lack the resources to enhance their living conditions. It is crucial that we unite our efforts to ensure everyone has the access they are entitled to, as this issue is not just a matter of convenience but a shared ethical obligation we all must address.

Zimbabwe – Proportion of rural population served with at least basic drinking water: A Global Perspective
In 2022, 52 percent of Zimbabwe’s rural population, about 5.8 million people, lacked access to safe drinking water, underscoring a pressing humanitarian crisis that demands urgent action. In contrast, countries like Thailand, Bangladesh, and Vietnam reported access rates of 100 percent, 98 percent, and 97 percent, respectively. These disparities reveal significant governance challenges in many Sub-Saharan African nations, highlighting the need for a unified and sustained effort to address these critical issues.

Zimbabwe-Access to Electricity
Zimbabwe- Access to electricity (% of population)
In 2022, the proportion of the population with access to electricity in Zimbabwe was 50.1 % in 2022. The proportion of the population with access to electricity in Zimbabwe increased from 33.7% in 2000 to 50.1% in 2022, an absolute change of 16.4 pp increase between 2000 and 2022.
Zimbabwe -Access to electricity (% urban population)
In 2022, the proportion of the urban population with access to electricity in Zimbabwe was 89%. The proportion of Zimbabwe’s urban population with access to electricity increased from 85.4% % in 2000 to 89% in 2022, an absolute change of 3.6 pp increase between 2000 and 2022.
Zimbabwe -Access to electricity (% of rural population)
In 2022, the proportion of the rural population with access to electricity in Zimbabwe was 33.7 %. The proportion of the rural population with access to electricity in Zimbabwe increased from 7.3% in 2000 to 33.7% in 2022, an absolute change of 26.4 pp increase.
Zimbabwe- Proportion of total population with access to electricity: A Global perspective
In 2022, nearly half of Zimbabwe’s population was without electricity, affecting over 8 million individuals who depend on this vital service for their daily needs. This alarming situation stands in stark contrast to nations such as Vietnam, Thailand, Sri Lanka, and Malaysia, which have successfully achieved universal electricity access. The pressing necessity for reform throughout Sub-Saharan Africa is clear, as the absence of dependable electricity jeopardizes development, health, education, and economic prospects, all of which are crucial for enhancing living standards and cultivating a sustainable future. Immediate collaborative action is essential to develop sustainable energy solutions that empower local communities and inspire transformative change.

Zimbabwe- Proportion of rural population with access to electricity : A Global perspective
In 2022, 66 percent of Zimbabwe’s rural population, nearly 7 million people, lived without electricity, revealing a stark disparity compared to countries like Vietnam, Thailand, and Sri Lanka, where all residents have reliable access to this essential resource. Even India and Bangladesh have 99 percent of their rural populations benefiting from dependable electricity, highlighting the urgent need for governance reforms in Sub-Saharan Africa. We must advocate for changes that ensure reliable electricity for all communities, empowering them to thrive and fostering a sustainable and prosperous future.

Zimbabwe – Health Outcomes
Zimbabwe- Life Expectancy: A Global Perspective
While the global average life expectancy for newborns has risen from 47 years in 1950 to 71 years in 2021, progress in Sub-Saharan Africa remains worryingly slow. For instance, Zimbabwe’s life expectancy has barely increased from 53 years in 1960 to 59 years in 2022, underscoring challenges like economic instability and limited access to healthcare. In contrast, nations such as South Korea have achieved significant improvements, with life expectancy soaring from 54 years in 1960 to 83 years in 2022, and the Maldives advancing from 39 years in 1960 to 81 years in 2022, illustrating the profound effects of effective healthcare and governance. The persistently low life expectancy in several sub-Saharan African countries highlights critical issues of chronic poverty, inadequate healthcare infrastructure, and governance failures, calling for immediate action to make global health advancements accessible to everyone.

Zimbabwe-Mortality rate, under-5 (per 1,000 live births): A Global Perspective
Since 1950, global child mortality rates have seen a significant decline, mainly due to improved living standards, access to healthcare, nutrition, and safe drinking water. In affluent European and American nations, child mortality has fallen to under four percent, reflecting effective healthcare systems and socioeconomic stability. While many developing countries in South America, Asia, and Africa have made notable progress, several Sub-Saharan nations still struggle with slow advancements. For instance, Zimbabwe’s under-five mortality rate decreased from 110 in 1980 to 48 in 2022, while Bangladesh improved from 206 to 29 and India from 169 to 29 in the same period. These figures highlight the challenges of inadequate healthcare and underscore the urgent need for governance reforms in Sub-Saharan Africa to further reduce child mortality and enhance health outcomes.

Zimbabwe – Maternal mortality ratio (per 100,000 live births): A Global Perspective
Zimbabwe’s maternal mortality ratio has decreased from 388 in 2000 to 357 in 2020, yet it remains alarmingly high, highlighting the significant challenges mothers face nationwide. While this progress is commendable, it is overshadowed by the much lower ratios in Bangladesh, India, and Vietnam, which reported rates of 123, 103, and 46 in 2022. These distressing figures expose the harsh reality of pregnancy-related fatalities, particularly in Sub-Saharan African nations. The stark statistics not only reveal deficiencies in the healthcare system but also reflect chronic underfunding in healthcare system in Sub-Saharan Africa. The disparities in maternal health outcomes compared to other developing regions underscore the immediate need for a united action and significant investment in health infrastructure in Zimbabwe.
