
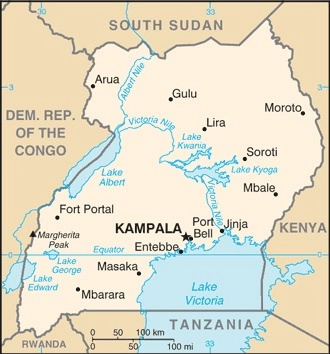
Uganda
Country Flag Details
six equal horizontal bands of black (top), yellow, red, black, yellow, and red; a white disk is superimposed at the center and depicts a grey crowned crane (the national symbol) facing the hoist side; black symbolizes the African people, yellow sunshine and vitality, red African brotherhood; the crane was the military badge of Ugandan soldiers under the UK.
Background
British influence in Uganda began in the 1860s with explorers seeking the source of the Nile. Uganda’s British-created colonial boundaries grouped together many ethnic groups with different political systems and cultures. These differences complicated efforts to establish a cohesive country after independence was achieved in 1962, and Uganda fell under authoritarian rule that led to economic ruin and mass atrocities.
Geography
Area
total : 241,038 sq km
land: 197,100 sq km
water: 43,938 sq km
Climate
tropical; generally rainy with two dry seasons (December to February, June to August); semiarid in northeast
Natural resources
copper, cobalt, hydropower, limestone, salt, arable land, gold
People and Society
Population
total: 49,283,041
Ethnic groups
Baganda 16.5%, Banyankole 9.6%, Basoga 8.8%, Bakiga 7.1%, Iteso 7%, Langi 6.3%, Bagisu 4.9%, Acholi 4.4%, Lugbara 3.3%, other 32.1% (2014 est.)
Languages
English (official), Ganda or Luganda (most widely used of the Niger-Congo languages and the language used most often in the capital), other Niger-Congo languages, Nilo-Saharan languages, Swahili (official), Arabic
Religions
Protestant 45.1% (Anglican 32.0%, Pentecostal/Born Again/Evangelical 11.1%, Seventh Day Adventist 1.7%, Baptist .3%), Roman Catholic 39.3%, Muslim 13.7%, other 1.6%, none 0.2% (2014 est.)
Population growth rate
3.18% (2024 est.)
Government
Government type
presidential republic
Capital name: Kampala
Executive branch
chief of state: President Yoweri Kaguta MUSEVENI (since 26 January 1986)
head of government: Prime Minister Robinah NABBANJA (since 14 June 2021)
Economy
Economic overview
low-income, primarily agrarian East African economy; COVID-19 hurt economic growth and poverty reduction; lower oil prices threaten prior sector investments; endemic corruption; natural resource rich; high female labor force participation but undervalued
Real GDP (purchasing power parity)
$135.803 billion (2023 est.)
$128.923 billion (2022 est.)
$123.267 billion (2021 est.)
Real GDP per capita
$2,800 (2023 est.)
$2,700 (2022 est.)
$2,700 (2021 est.)
Exports
$9.085 billion (2023 est.)
$6.115 billion (2022 est.)
$6.231 billion (2021 est.)
Exports – partners
India 21%, UAE 16%, Hong Kong 10%, South Sudan 8%, Kenya 6% (2023)
Exports – commodities
gold, coffee, fish, refined petroleum, tobacco (2023)
Imports
$13.853 billion (2023 est.)
$11.079 billion (2022 est.)
$10.62 billion (2021 est.)
Imports – partners
China 19%, UAE 12%, Tanzania 11%, India 10%, Kenya 7% (2023)
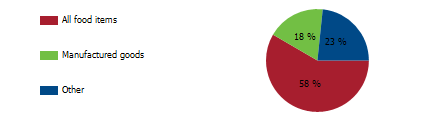
Explore structure by product group in 2023 (% of total exports) (UNCTAD)
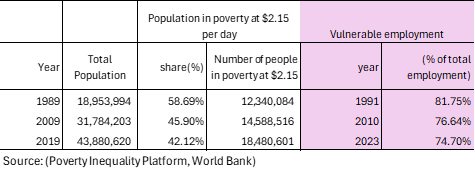
Poverty and vulnerable employment in Uganda
Understanding poverty level significance at $2.15 per day
In 2019, 42 percent of Ugandans survived on only $2.15 a day, underscoring the critical need for sustainable poverty reduction strategies. The poverty level at $2.15 per day (measured in 2017 purchasing power parity, or PPP) is a key global benchmark used by the World Bank to define extreme poverty in low-income countries. It indicates:
1. Basic Survival Threshold
• People living below $2.15 per day struggle to afford essential needs such as food, clean water, shelter, healthcare, and education.
2. Economic Underdevelopment
• A high percentage of a country’s population living below this threshold suggests low economic productivity, high unemployment, and weak social safety nets.
3. Inequality and Social Vulnerability
• It reflects deep income inequality and a lack of access to opportunities for upward mobility.
• People in this category are more vulnerable to shocks like food price increases, climate disasters, or health crises.
4. Policy Challenges
• Governments need targeted interventions such as social welfare programs, job creation, and improved access to education and healthcare to reduce poverty.
A country's export structure is a reflection of its level of development and productive capacities
The export structure of a country refers to the composition, diversity, and value of the goods and services it sells to other countries. It provides key insights into the country’s economic health, competitiveness, and level of development. Productive capacities of a country refer to its ability to produce goods and services efficiently and sustainably over time. These capacities are shaped by various factors, including human capital, natural resources, infrastructure, private sector, development, technology & innovation, institutions & governance, financial systems trade & market access.
Here’s what the export structure and productive capacities of a country typically indicate:
- Level of Economic Development
- Developed economies usually export high-value manufactured goods, technology, and services.
- Developing economies often rely on raw materials, agricultural products, or low-value manufactured goods.
- Industrial and Sectoral Strengths
- A strong presence of high-tech or industrial goods (e.g., machinery, electronics) suggests a well-developed manufacturing sector.
- A dominance of commodities (e.g., oil, minerals, agricultural products) indicates reliance on natural resources.
- Export Diversification
- A diverse export base (multiple industries) makes a country’s economy more stable and resilient to global price shocks.
- A concentrated export base (few key products) makes it vulnerable to market fluctuations.
- Trade Partnerships and Dependence
- If exports are heavily dependent on a single country or region, the economy is more exposed to geopolitical and trade risks.
- A wide range of trading partners indicates stronger global integration.
- Competitiveness and Value Addition
- Exporting mainly raw materials (e.g., crude oil instead of refined petroleum) suggests limited industrial processing capacity.
- A high share of finished and high-tech goods suggests strong value addition and competitiveness.
Uganda-Sanitation
Uganda – Proportion of population served with at least basic sanitation
In 2022, the proportion of the population in Uganda with access to at least basic sanitation reached 21.0 percent, a gradual increase from 16.4 percent in 2000, an absolute change of 4.6 percentage points (pp) between 2000 and 2022.
Uganda – Proportion of urban population served with at least basic sanitation
In 2022, the proportion of Uganda’s urban population with access to at least basic sanitation was 29.9 percent. The proportion of Uganda’s urban population with access to at least basic sanitation increased from 27.8 percent in the year 2000 to 29.9 percent in 2022, an absolute change of 2.1 pp between 2000 and 2022.
Uganda – Proportion of rural population served with at least basic sanitation
In 2022, the proportion of Uganda’s rural population with access to basic sanitation was 17.8 %. The proportion of Uganda’s rural population with at least basic sanitation increased from 14.4% in 2000 to 17.9 % in 2022, an absolute change of 3.5 pp.
Uganda- Proportion of population with access to basic sanitation (% of total population): A Global Perspective
Uganda is facing a serious challenge with unsafe sanitation, an urgent issue that requires our collective action to prevent the tragic loss of lives each year as we confront this public health crisis. Access to safe sanitation is not just vital; it is a fundamental human right that every individual deserves, regardless of socio-economic status. In 2022, around 38 million people, nearly 79 percent of Uganda’s population, suffered due to inadequate sanitation, especially in contrast to countries like Vietnam, China, and Thailand, where only 8 percent, 5 percent, and 1 percent respectively lacked these essential services. With the global average at about 6 percent, it is crucial for us to mobilize efforts to improve sanitation access in marginalized areas of Sub-Saharan Africa, turning this crisis into an opportunity for meaningful change and fostering a healthier future for all.

Uganda- Proportion of rural population with access to basic sanitation (% of total population): A Global Perspective
In 2022, nearly 25 million people in rural Uganda, about 82 percent of the rural population, lacked access to basic sanitation, starkly contrasting with Vietnam, Sri Lanka, and Thailand, where the proportions were significantly lower at 12 percent, 5 percent, and 2 percent. This lack of safe sanitation is not just an urgent challenge but a critical issue that needs our immediate compassion, as it leads to countless lives lost and exacerbates a growing public health crisis. Safe sanitation is a fundamental human right, essential for health and dignity. We must unite in advocating for this right across Sub-Saharan Africa, where the urgency is clear, and the potential for positive change is vital for improving the well-being and dignity, ensuring a healthier future for generations to come.

Uganda: Water supply
Uganda – Proportion of population served with at least basic sanitation
In 2022, the proportion of the population in Uganda with access to at least basic drinking water reached 59.3 percent. The proportion of the population in Uganda with access to at least basic drinking water increased from 26.4 percent in 2000 to 59.3 percent in 2022, an absolute increase of 32.9 pp between 2000 and 2022.
Uganda – Proportion of urban population served with at least basic sanitation
In 2022, the proportion of Uganda’s urban population with access to at least basic drinking water was 80.3 percent. The proportion of Uganda’s urban population with access to at least basic drinking water increased from 69.6 percent in 2000 to 80.3 percent in 2022, an absolute increase of 10.7 pp between 2000 and 2022.
Uganda – Proportion of rural population served with at least basic sanitation
In 2022, the percent of the rural population with at least basic drinking water in Uganda was 51.8 percent. The proportion of the rural population served with at least basic drinking water in Uganda increased from 18.9 percent in 2000 to 51.8 percent in 2022, an absolute change of 32.9 pp between 2000 and 2022.
Uganda- Proportion of population served with at least basic drinking water: A Global Perspective
Access to safe drinking water is a fundamental human right that must be available to all. In 2022, about 20 million people in Uganda, or 41 percent of the population, lacked this essential resource, highlighting a severe public health crisis. In contrast, everyone in Thailand and 98 percent in Vietnam and Bangladesh had reliable access. This stark disparity underscores the urgent need for transformative change across Sub-Saharan Africa. We must unite to ensure all communities in the region gain access to this vital resource for improved health and well-being.

Uganda- Proportion of rural population served with at least basic drinking water: A Global Perspective
In 2022, it is alarming that 48 percent of Uganda’s rural population, about 17 million people, lacked access to safe drinking water, highlighting a critical humanitarian crisis that requires our immediate action; this stark reality contrasts with the achievements of countries like Thailand, Bangladesh, and Vietnam, where nearly all rural residents have access to safe drinking water at 100 percent, 98 percent, and 97 percent respectively. This disparity reflects the governance challenges faced by many Sub-Saharan African nations and serves as a call for us to unite in solidarity to create meaningful change. Together, we can improve living conditions and ensure vulnerable communities receive the essential resources they deserve, paving the way for a hopeful, equitable future filled with opportunities for all.

Uganda-Access to Electricity
Uganda- Access to electricity (% of population)
In 2022, the proportion of the population with access to electricity in Uganda was 47.1 percent. The proportion of the population with access to electricity in Uganda increased from 7.4 % in 2000 to 47.1% in 2022, an absolute change of 39.7pp between 2000 and 2022.
Uganda- Access to electricity (% urban population)
In 2022, the proportion of the urban population with access to electricity in Uganda was 72%. The proportion of the urban population with access to electricity in Uganda increased from 41 % in 2000 to 72% in 2022, an absolute change of 31 pp between 2000 and 2022.
Uganda – Access to electricity (% of rural population)
In 2022, the proportion of the rural population with access to electricity in Uganda was 35.9 %. The proportion of the rural population with access to electricity in Uganda increased from 1.6 % in 2000 to 35.9% in 2022, an absolute change of 34.3pp between 2000 and 2022.
Uganda- Proportion of population with access to electricity: A Global Perspective
In 2022, approximately 53 percent of Uganda’s population lacked access to electricity, impacting over 26 million people. This dire situation contrasts sharply with countries such as Vietnam, Thailand, Sri Lanka, and Malaysia that have achieved universal electricity access, underscoring the urgent need for reforms across Sub-Saharan Africa to improve living conditions. The absence of reliable electricity hampers development, health, education, and economic opportunities, which are vital for enhancing living standards and fostering hope for a sustainable future. Prioritizing equitable electricity access is essential to empower communities, stimulate innovation, and build a resilient society capable of addressing contemporary challenges.

Uganda- Proportion of rural population with access to electricity: A Global Perspective
In 2022, a staggering 66 percent of Uganda’s rural population, nearly 23 million people, lived without electricity, starkly contrasting with countries like Vietnam, Thailand, and Sri Lanka, where all rural residents have access to this essential resource. Meanwhile, India and Bangladesh reported an impressive 99 percent of their rural populations benefiting from reliable electricity. These figures highlight the critical need for transformative governance reforms throughout Sub-Saharan Africa, ensuring every community not only secures dependable electricity but also has the chance to thrive and pursue a sustainable and prosperous future.

Uganda: Health outcomes
Uganda-Life expectancy: A Global Perspective
An analysis of life expectancy trends over the past seventy years shows significant progress in increasing both the length and quality of life for many; however, stark disparities in health outcomes, especially in Sub-Saharan Africa, require urgent attention. From 1950 to 2021, global average life expectancy for newborns rose from 47 to 71 years, yet countries in Sub-Saharan Africa face ongoing challenges, as seen in Uganda where life expectancy climbed from 46 years in 1960 to 64 years in 2022. Conversely, nations like South Korea saw life expectancy soar from 54 years in 1960 to 83 years in 2022, and the Maldives improved from 39 years in 1960 to 81 years in 2022. The low life expectancy in many Sub-Saharan African countries highlights critical issues like chronic poverty and inadequate healthcare, emphasizing the need for initiatives that promote a sustainable and equitable future for these communities.

Uganda-Mortality rate, under-5 (per 1,000 live births): A Global Perspective
Uganda’s under-five mortality rate per 1000 live births remains a critical global concern that demands urgent attention. Since 1950, substantial declines in child mortality rates have been observed worldwide, attributed to improvements in living standards, access to healthcare, nutrition, and safe drinking water. In developed regions such as Europe and America, child mortality rates are below 4 percent, reflecting the strength of their healthcare systems. In contrast, many Sub-Saharan African countries, including Uganda, have made slower strides. For instance, Uganda’s under-five mortality rate decreased from 219 in 1980 to 41 in 2022, whereas Bangladesh and India made notable reductions from 206 and 169 in 1980 to 29 in 2022, respectively. These statistics underscore the persistent challenges posed by inadequate healthcare systems in Sub-Saharan Africa, highlighting the urgent necessity for comprehensive governance reforms to address child mortality and enhance health outcomes for vulnerable populations in the region.

Uganda-Maternal mortality ratio (per 100,000 live births): A Global Perspective
Uganda’s maternal mortality ratio presents a pressing challenge as it has only declined from 461 in 2000 to 284 in 2020, revealing significant room for improvement. However, the contrast with nations like Bangladesh, India, and Vietnam, which reported maternal deaths of 123, 103, and 46 respectively in 2022, highlights the urgent need to tackle pregnancy-related fatalities in Uganda. This situation is further complicated by high birth rates and ongoing maternal health issues. The healthcare system faces considerable hurdles, compounded by chronic underfunding across many Sub-Saharan African countries, emphasizing the critical need for substantial investments in health care systems to improve maternal health outcomes. Through collective efforts, we can strive to ensure the safety of mothers and their children, transforming this challenging reality into a success story that empowers communities and paves the way for a healthier future for generations to come.
