Sao Tome and Principe
Country Flag Details
three horizontal bands of green (top), yellow (double width), and green with two black five-pointed stars placed side by side in the center of the yellow band and a red isosceles triangle based on the hoist side; green stands for the country’s rich vegetation, red recalls the struggle for independence, and yellow represents cocoa, one of the country’s main agricultural products; the two stars symbolize the two main islands
note: uses the popular Pan-African colors of Ethiopia
Background
Portugal discovered and colonized the uninhabited Sao Tome and Principe islands in the late 15th century, setting up a sugar-based economy that gave way to coffee and cocoa in the 19th century. Independence was achieved in 1975, but democratic reforms were not instituted until the late 1980s. The country held its first free elections in 1991.
Geography
Area
total : 964 sq km
land: 964 sq km
water: 0 sq km
Climate
tropical; hot, humid; one rainy season (October to May)
Natural resources
fish, hydropower
People and Society
Population
total: 223,561
Ethnic groups
Mestico, Angolares (descendants of Angolan slaves), Forros (descendants of freed slaves), Servicais (contract laborers from Angola, Mozambique, and Cabo Verde), Tongas (children of servicais born on the islands), Europeans (primarily Portuguese), Asians (mostly Chinese)
Languages
Portuguese 98.4% (official), Forro 36.2%, Cabo Verdian 8.5%, French 6.8%, Angolar 6.6%, English 4.9%, Lunguie 1%, other (including sign language) 2.4%; other Portuguese-based Creoles are also spoken (2012 est.)
Religions
Catholic 55.7%, Adventist 4.1%, Assembly of God 3.4%, New Apostolic 2.9%, Mana 2.3%, Universal Kingdom of God 2%, Jehovah’s Witness 1.2%, other 6.2%, none 21.2%, unspecified 1% (2012 est.)
Population growth rate
1.42% (2024 est.)
Government
Government type
semi-presidential republic
Capital name: Sao Tome
Executive branch
chief of state: President Carlos Manuel VILA NOVA (since 2 October 2021)
head of government: Prime Minister Américo d’Oliveira DOS RAMOS (since 12 January 2025)
Economy
Economic overview
lower middle-income Central African island economy; falling cocoa production due to drought and mismanagement; joint oil venture with Nigeria; government owns 90% of land; high debt, partly from fuel subsidies; tourism gutted by COVID-19
Real GDP (purchasing power parity)
$1.279 billion (2023 est.)
$1.275 billion (2022 est.)
$1.272 billion (2021 est.)
Real GDP per capita
$5,500 (2023 est.)
$5,600 (2022 est.)
$5,700 (2021 est.)
Exports
$96.977 million (2022 est.)
$75.256 million (2021 est.)
$49.337 million (2020 est.)
Exports – partners
Pakistan 54%, Germany 11%, Netherlands 7%, France 5%, UAE 3% (2023)
Exports – commodities
crude petroleum, cocoa beans, vehicle parts/accessories, palm oil, aircraft parts (2023)
Imports
$219.322 million (2022 est.)
$201.145 million (2021 est.)
$160.097 million (2020 est.)
Imports – partners
Portugal 35%, Angola 13%, Gabon 11%, Japan 8%, China 6% (2023)
Imports – commodities
ships, refined petroleum, rice, electric generating sets, cars (2023)
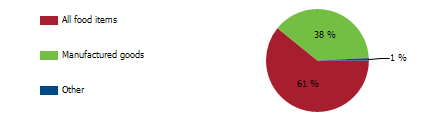
Export structure by product group in 2023 (% of total exports) (UNCTDA)
The export structure of a nation provides a comprehensive insight into the diversity, composition, and value of the goods and services it trades on the international stage, acting as a critical indicator of the economic health, competitive position, and developmental progress of the country. In the specific context of São Tomé and Príncipe, this export framework is primarily defined by agricultural products, with cocoa beans standing out as the most significant export item. Despite the positive strides made in diversifying the export portfolio and exploring new markets, the economy continues to show a marked reliance on a narrow spectrum of key products and specific trading partners, which highlights both the challenges and opportunities for future growth and resilience in the global marketplace.
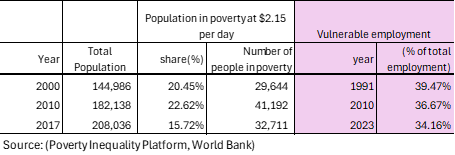
Poverty and vulnerable employment in Sao Tome and Principe (World Bank)
In 2023, 34 percent of total employment in Sao Tome and Principe was classified as vulnerable employment, which encompasses work characterized by insufficient job security, meager wages, and an absence of social protections such as health insurance, pensions, or labor rights. This category primarily includes Own-Account Workers, individuals who engage in self-employment without hiring workers, exemplified by street vendors and small-scale farmers, and Contributing Family Workers, who contribute to family-owned businesses or farms without receiving formal compensation. Such employment is predominantly informal and unstable, devoid of benefits, rendering workers particularly vulnerable to economic fluctuations, exploitation, and poverty. The repercussions of this employment type extend beyond individual workers to affect families and communities, thereby perpetuating cycles of instability and hardship that are notably difficult to transcend.
Understanding poverty level significance at $2.15 per day
In 2017, 33 thousand people in Sao Tome and Principe lived in poverty at $2.15 per day. The poverty level at $2.15 per day (measured in 2017 purchasing power parity, or PPP) is a key global benchmark used by the World Bank to define extreme poverty in low-income countries. It indicates:
1. Basic Survival Threshold
• People living below $2.15 per day struggle to afford essential needs such as food, clean water, shelter, healthcare, and education.
2. Economic Underdevelopment
• A high percentage of a country’s population living below this threshold suggests low economic productivity, high unemployment, and weak social safety nets.
3. Inequality and Social Vulnerability
• It reflects deep income inequality and a lack of access to opportunities for upward mobility.
• People in this category are more vulnerable to shocks like food price increases, climate disasters, or health crises.
4. Policy Challenges
• Governments need targeted interventions such as social welfare programs, job creation, and improved access to education and healthcare to reduce poverty.
A country's export structure is a reflection of its level of development and productive capacities
The export structure of a country refers to the composition, diversity, and value of the goods and services it sells to other countries. It provides key insights into the country’s economic health, competitiveness, and level of development. Productive capacities of a country refer to its ability to produce goods and services efficiently and sustainably over time. These capacities are shaped by various factors, including human capital, natural resources, infrastructure, private sector, development, technology & innovation, institutions & governance, financial systems trade & market access.
Here’s what the export structure and productive capacities of a country typically indicate:
- Level of Economic Development
- Developed economies usually export high-value manufactured goods, technology, and services.
- Developing economies often rely on raw materials, agricultural products, or low-value manufactured goods.
- Industrial and Sectoral Strengths
- A strong presence of high-tech or industrial goods (e.g., machinery, electronics) suggests a well-developed manufacturing sector.
- A dominance of commodities (e.g., oil, minerals, agricultural products) indicates reliance on natural resources.
- Export Diversification
- A diverse export base (multiple industries) makes a country’s economy more stable and resilient to global price shocks.
- A concentrated export base (few key products) makes it vulnerable to market fluctuations.
- Trade Partnerships and Dependence
- If exports are heavily dependent on a single country or region, the economy is more exposed to geopolitical and trade risks.
- A wide range of trading partners indicates stronger global integration.
- Competitiveness and Value Addition
- Exporting mainly raw materials (e.g., crude oil instead of refined petroleum) suggests limited industrial processing capacity.
- A high share of finished and high-tech goods suggests strong value addition and competitiveness.
Sao Tome and Principe-Sanitation
Sao Tome and Principe- Proportion of population served with at least basic sanitation
In 2022, proportion of population served with at least basic sanitation for Sao Tome and Principe was 47.8 %. Proportion of population served with at least basic sanitation of Sao Tome and Principe increased from 20.6 % in 2000 to 47.8 % in 2022 an absolute change of 27.2 percentage points between 2000 and 2022.
Sao Tome and Principe – Proportion of urban population served with at least basic sanitation facilities
Sao Tome and Principe – Proportion of rural population served with at least basic sanitation facilities
In 2022, proportion of rural population served with at least basic sanitation for Sao Tome and Principe was 39.3 %. Proportion of rural population served with at least basic sanitation of Sao Tome and Principe increased from 13.1 % in 2000 to 39.3 % in 2022 an absolute change of 26.2 pp increase between 2000 and 2022.
Sao Tome and Principe- Share of the population using at least basic sanitation facilities: A Global Perspective
Unsafe sanitation is a significant public health crisis causing the unnecessary loss of lives each year. Access to safe sanitation is not just a basic need but a fundamental human right. In 2022, only 47.8% of the population in Sao Tome and Principe had access to basic sanitation services, indicating severe deficiencies in public health infrastructure. In comparison, countries like China, Indonesia, Sri Lanka, Thailand, and Vietnam reported access rates of 95.9%, 88.2%, 95.1%, and 99.0%. Ensuring safe sanitation is vital for health, dignity, and well-being, underscoring the urgent need for collective efforts to implement sustainable governance and inclusive strategies that ensure safe sanitation for all in Sub-Saharan Africa.

Sao Tome and Principe- Share of the rural population served with at least basic sanitation: A Global Perspective
Many individuals in rural Sao Tome and Principe struggle with a significant lack of basic sanitation facilities, a critical issue that often goes unnoticed yet deeply affects their lives. Access to safe sanitation is a fundamental human right, yet only 39.3% of this population had proper facilities in 2022, much lower than in Sri Lanka, Thailand, and Vietnam. These alarming figures highlight the urgent need for action. We urge you to examine the accompanying chart to grasp these disparities. Supporting initiatives to enhance sanitation infrastructure is essential for safeguarding health and dignity. Our commitment to addressing these inequalities is vital for sustainable development, ensuring every community achieves the sanitation they deserve. Together, we can build a future where safe sanitation is a reality, greatly improving the quality of life for rural populations.

Sao Tome and Principe-Water Supply
Sao Tome and Principe – Proportion of total population served with at least basic drinking water
In 2022, proportion of population served with at least basic water for Sao Tome and Principe was 77.3 %. Proportion of population served with at least basic water of Sao Tome and Principe increased from 68.8 % in 2000 to 77.3 % in 2022 an absolute increase of 8.5 pp between 2000 and 2022.
Sao Tome and Principe – Proportion of urban population served with at least basic water
In 2022, proportion of urban population served with at least basic water for Sao Tome and Principe was 79.3 %. Proportion of urban population served with at least basic water of Sao Tome and Principe increased from 74.4% in 2000 to 79.3 % in 2022 an absolute change of 4.9 pp between 2000 and 2022.
Sao Tome and Principe – Proportion of rural population served with at least basic water
In 2022, proportion of rural population served with at least basic water for Sao Tome and Principe was 71.1 %. Proportion of rural population served with at least basic water of Sao Tome and Principe increased from 62.3 % in 2000 to 71.1 % in 2022 an absolute change of 9.4 pp between 2000 and 2022.
Sao Tome and Principe – Proportion of Total Population Served with at Least Basic Water: A Global Perspective
As of 2022, it was reported that 77.3% of the population in Sao Tome and Principe now has access to at least basic water services. This represents a remarkable leap from just 68.8% in the year 2000. Yet, this progress starkly contrasts with the 100% access enjoyed by populations in countries like South Korea and Thailand, where safe drinking water is a given. These disparities in water accessibility are more than mere statistics; they reflect the real challenges that communities face, impacting health, education, and overall quality of life. It is essential that we acknowledge these inequalities and champion sustainable solutions and infrastructure that can guarantee every individual access to this vital resource.(Refer to the chart below for a visual comparison that illustrates these disparities.)

Sao Tome and Principe – Share of the rural population using at least basic drinking Water Facilities
As of 2022, only 71.1% of the rural population in Sao Tome and Principe had access to basic sanitation services, a slight increase from 62.3% in 2000. This troubling trend starkly contrasts with countries like Vietnam, where safe drinking water is a standard expectation. Such a disparity highlights the urgent need for improvements in infrastructure and resources, ensuring that everyone can access the essential services they deserve. These variations in water accessibility represent significant challenges for communities, affecting health, education, and overall quality of life. Addressing these issues is vital for fostering a healthier and more equitable future for all.

Sao Tome and Principe-Access to Electricity
Sao Tome and Principe-Access to electricity (% of population)
In 2022, the proportion of the population with access to electricity for Sao Tome and Principe was 78%. The proportion of the population with access to electricity of Sao Tome and Principe increased from 52.9% in 2000 to 78% in 2022, an absolute change of 25.1 pp increase between 2000 and 2022.
Sao Tome and Principe-Access to Electricity (% urban population)
In 2022, the proportion of the urban population with access to electricity in São Tomé and Principe was 80%. The proportion of urban population with access to electricity in Sao Tome and Principe increased from 64.1% % in 2000 to 80% in 2022, an absolute decrease of 15.9 pp increase between 2000 and 2022.
Sao Tome and Principe-Access to electricity (% rural population)
In 2022, proportion of rural population with access to electricity for Sao Tome and Principe was 73.7%. The proportion of rural population of Sao Tome and Principe with access to electricity of Sao Tome increased from 40.1 %in 2000 to 73.7 pp in 2022, an absolute change of 33.6 pp between 2000 and 2022.
Sao Tome and Principe- Access to Electricity as a Percentage of the Population: A Global Perspective.
In the year 2022, an impressive 78% of Sao Tome and Principe ‘s population gained access to electricity, marking a notable increase from 52.9% in the year 2000. This progress, while commendable, still places Sao Tome and Principe behind many nations. For instance, countries like Thailand and South Korea have achieved full access to electricity at a remarkable rate of 100%, while Vietnam and Bangladesh are not far behind, nearing 99%. Access to electricity is not just a convenience; it is a fundamental necessity for alleviating poverty and fostering economic development. However, despite this overall advancement, several countries in Sub-Saharan Africa, including Sao Tome and Principe, continue to face significant challenges in achieving widespread electricity access. For a deeper understanding, be sure to check the chart that illustrates electrification rates across developing regions.

Equatorial Guinea-Access to electricity (% of the rural population): A Global Perspective
Access to electricity is not just a convenience; it is a lifeline that can transform lives, lift communities out of poverty, and foster economic growth. Understanding how many people have access to electricity is essential for gauging social and economic progress. Globally, we have witnessed a remarkable increase in electricity access over the past few decades. This positive shift has largely been fueled by advancements in low and middle-income countries. However, the journey is far from complete. In some regions, the struggle for electricity access remains a harsh reality. Our chart invites you to explore the electrification rates in rural Sao Tome and Principe, placing it alongside other developing nations. As of 2022, only 73.7% of the rural population in Sao Tome and Principe had access to electricity, a significant increase from 40.1 % in 2000. In stark contrast, rural communities in Vietnam, Thailand, South Korea, Malaysia, and China enjoy the benefits of 100% electricity access in 2022. This disparity highlights the urgent need for action and support to ensure that every individual can experience the life-changing benefits of electricity.

São Tome and Principe – Health Outcomes
Sao Tome and Principe-Life expectancy: A Global Perspective
In the past seventy years, life expectancy has notably improved, enabling many to live longer and healthier lives. In 1950, the average life expectancy for newborns globally was just 47 years, reflecting significant challenges. By 2021, it rose to 71 years, illustrating our progress. However, this advancement has not been uniform, especially in Sub-Saharan Africa, where improvements have been slower. For example, Sao Tome and Principe’s life expectancy increased from 43 years in 1960 to 69 years in 2022, showing resilience and gradual growth. In contrast, South Korea’s life expectancy surged from 54 years in 1960 to 83 years in 2022, while the Maldives rose from 39 years in 1960 to 81 years in 2022.


Sao Tome and Principe- Mortality rates , under-5 (per 1000 births): A Global Perspective
Since 1950, the world has made tremendous progress in reducing child mortality rates, thanks to better living conditions, advancements in healthcare, improved nutrition, and access to clean drinking water. In the wealthiest nations of Europe and America, child mortality rates have plummeted to below 4 percent. Meanwhile, many developing countries across South America and Asia have also made significant strides in this area. However, the pace of change has been slower in many Sub-Saharan African nations. For instance, in 1990, Sao Tome had child mortality rates of 108.5 and South Korea had 16respectively. By 2022, these figures diverged dramatically, with Sao Tome and Principe’s child mortality rate at 14 deaths, while and South Korea boasts a remarkable 3, showcasing the progress made in South Korea(Refer to the chart below for a virtual comparison).


Sao Tome and Principe-Maternal Mortality Rate: A Global Perspective
The chart below powerfully illustrates the annual number of pregnancy-related deaths across various regions and countries, bringing to light a sobering reality: a significant proportion of these tragic losses occur within Sub-Saharan Africa. This alarming trend can be attributed to a combination of factors, including a higher birth rate in the region and persistently elevated maternal mortality rates. For instance, in Bangladesh, remarkable progress has been made, with maternal deaths plummeting from 441 in the year 2000 to just 123 in 2022, showcasing the impact of improved healthcare initiatives. In stark contrast, Sao Tome and Principe has experienced only a modest decline in maternal deaths, with rates decreasing from 179 per 100,000 live births in 2000 to an estimated 146 in 2022. This highlights the urgent need for enhanced maternal health services and support in the country. For a more comprehensive understanding, please refer to the chart below for a visual comparison of these critical statistics.

