Kenya
Country Flag Details
three equal horizontal bands of black (top), red, and green; the red band is edged in white; a large Maasai warrior’s shield covering crossed spears is superimposed at the center; black symbolizes the majority population, red the blood shed in the struggle for freedom, green stands for natural wealth, and white for peace; the shield and crossed spears symbolize the defense of freedom.
Background
Kenya gained independence from the United Kingdom in 1963. In 2010, Kenyans voted to adopt a new constitution that introduced additional checks and balances to executive power and devolved power and resources to 47 newly created counties.
Geography
Area
total : 580,367 sq km
land: 569,140 sq km
water: 11,227 sq km
Climate
varies from tropical along coast to arid in interior
Natural resources
limestone, soda ash, salt, gemstones, fluorspar, zinc, diatomite, gypsum, wildlife, hydropower
People and Society
Population
total: 58,246,378
Ethnic groups
Kikuyu 17.1%, Luhya 14.3%, Kalenjin 13.4%, Luo 10.7%, Kamba 9.8%, Somali 5.8%, Kisii 5.7%, Mijikenda 5.2%, Meru 4.2%, Maasai 2.5%, Turkana 2.1%, non-Kenyan 1%, other 8.2% (2019 est.)
Languages
English (official), Kiswahili (official), numerous indigenous languages
Religions
Christian 85.5% (Protestant 33.4%, Catholic 20.6%, Evangelical 20.4%, African Instituted Churches 7%, other Christian 4.1%), Muslim 10.9%, other 1.8%, none 1.6%, don’t know/no answer 0.2% (2019 est.)
Population growth rate
2.06% (2024 est.)
Government
Government type
presidential republic
Capital name: Nairobi
Executive branch
chief of state: President William RUTO (since 13 September 2022)
head of government: President William RUTO (since 13 September 2022)
Economy
Economic overview
fast growing, third largest Sub-Saharan economy; strong agriculture sector with emerging services and tourism industries; IMF program to address current account and debt service challenges; business-friendly policies foster infrastructure investment, digital innovation and public-private partnerships; vulnerable to climate change-induced droughts
Real GDP (purchasing power parity)
$314.491 billion (2023 est.)
$297.938 billion (2022 est.)
$284.129 billion (2021 est.)
Real GDP per capita
$5,700 (2023 est.)
$5,500 (2022 est.)
$5,300 (2021 est.)
Exports
$12.626 billion (2023 est.)
$13.954 billion (2022 est.)
$11.815 billion (2021 est.)
Exports – partners
Uganda 10%, USA 10%, UAE 8%, Netherlands 8%, Pakistan 6% (2023)
Exports – commodities
tea, cut flowers, garments, gold, tropical fruits (2023)
Imports
$22.046 billion (2023 est.)
$24.606 billion (2022 est.)
$22.001 billion (2021 est.)
Imports – partners
China 22%, UAE 14%, India 10%, Saudi Arabia 5%, Malaysia 4% (2023)
Imports – commodities
refined petroleum, palm oil, wheat, plastics, garments (2023)
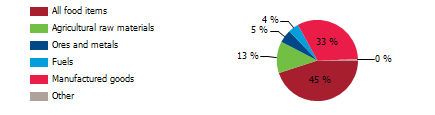
Export structure by product group in 2023 (% of total exports) (UNCTAD)
The export structure of a country involves the variety, composition, and value of its internationally traded goods and services, providing vital insights into its economic vitality, competitiveness, and developmental stage. In Kenya, this export structure is evolving from a historical dependence on agriculture to a more diversified portfolio that now includes manufactured goods, minerals, and services. This change not only reflects shifting market demands but also underscores the nation’s commitment to broadening its economic base. Despite ongoing challenges, sustained investments in value addition, regional trade, and industrialization are setting the stage for robust export growth, cultivating a more resilient economy capable of adapting to global trends and opportunities.
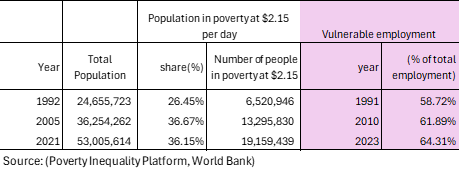
Poverty and vulnerable employment in Kenya
In 2023, 64 percent of Kenya’s total employment was categorized as vulnerable employment, which denotes work characterized by insufficient job security, low wages, and a lack of vital social protections such as health insurance, pensions, and labor rights. This classification primarily includes own-account workers—those engaged in self-employment without any employees, like street vendors and small-scale farmers—as well as contributing family workers who support family businesses or farms without formal compensation. Employment in this category is often informal and unstable, lacking essential benefits, which leaves these workers particularly exposed to economic shocks, exploitation, and poverty. The effects of this vulnerable employment extend beyond the individual, impacting families and communities, and perpetuating cycles of instability and hardship that are exceedingly difficult to break.
Understanding poverty level significance at $2.15 per day
In 2021, 36 percent of Kenya’s population (19 million people) was identified as living in poverty at an income threshold of $ 2.15 per day. The poverty level at $2.15 per day (measured in 2017 purchasing power parity, or PPP) is a key global benchmark used by the World Bank to define extreme poverty in low-income countries. It indicates:
1. Basic Survival Threshold
• People living below $2.15 per day struggle to afford essential needs such as food, clean water, shelter, healthcare, and education.
2. Economic Underdevelopment
• A high percentage of a country’s population living below this threshold suggests low economic productivity, high unemployment, and weak social safety nets.
3. Inequality and Social Vulnerability
• It reflects deep income inequality and a lack of access to opportunities for upward mobility.
• People in this category are more vulnerable to shocks like food price increases, climate disasters, or health crises.
4. Policy Challenges
• Governments need targeted interventions such as social welfare programs, job creation, and improved access to education and healthcare to reduce poverty.
A country's export structure is a reflection of its level of development and productive capacities
The export structure of a country refers to the composition, diversity, and value of the goods and services it sells to other countries. It provides key insights into the country’s economic health, competitiveness, and level of development. Productive capacities of a country refer to its ability to produce goods and services efficiently and sustainably over time. These capacities are shaped by various factors, including human capital, natural resources, infrastructure, private sector, development, technology & innovation, institutions & governance, financial systems trade & market access.
Here’s what the export structure and productive capacities of a country typically indicate:
- Level of Economic Development
- Developed economies usually export high-value manufactured goods, technology, and services.
- Developing economies often rely on raw materials, agricultural products, or low-value manufactured goods.
- Industrial and Sectoral Strengths
- A strong presence of high-tech or industrial goods (e.g., machinery, electronics) suggests a well-developed manufacturing sector.
- A dominance of commodities (e.g., oil, minerals, agricultural products) indicates reliance on natural resources.
- Export Diversification
- A diverse export base (multiple industries) makes a country’s economy more stable and resilient to global price shocks.
- A concentrated export base (few key products) makes it vulnerable to market fluctuations.
- Trade Partnerships and Dependence
- If exports are heavily dependent on a single country or region, the economy is more exposed to geopolitical and trade risks.
- A wide range of trading partners indicates stronger global integration.
- Competitiveness and Value Addition
- Exporting mainly raw materials (e.g., crude oil instead of refined petroleum) suggests limited industrial processing capacity.
- A high share of finished and high-tech goods suggests strong value addition and competitiveness.
Kenya-Sanitation
Kenya – Proportion of population served with at least basic sanitation
In 2022, proportion of population served with at least basic sanitation for Kenya was 36.2 %. Proportion of population served with at least basic sanitation of Kenya increased from 28.1 % in 2000 to 36.2 % in 2022 an absolute change of 8.1 percentage points (pp) between 2000 and 2022.
Kenya – Proportion of urban population served with at least basic sanitation
In 2022, proportion of urban population served with at least basic sanitation for Kenya was 39.8 %. Proportion of urban population served with at least basic sanitation of Kenya increased from 30.0 % in 2000 to 39.8 % in 2022 an absolute change of 9.8 pp between 2000 and 2022.
Kenya – Proportion of rural population served with at least basic sanitation
In 2022, proportion of rural population served with at least basic sanitation for Kenya was 35.2 %. Proportion of rural population served with at least basic sanitation of Kenya increased from 27.6 % in 2000 to 35.2 % in 2022 an absolute increase of 7.6 pp between 2000 and 2022.
Kenya- Proportion of population served with at least basic drinking water: A Global Perspective
The persistent lack of safe sanitation is a critical challenge that affects countless lives and results in preventable deaths for hundreds of thousands each year, revealing a public health crisis that demands urgent action. Access to safe sanitation is a fundamental human right that should be guaranteed for all, ensuring dignity and health. In 2022, about 35 million people in Kenya, or 64 percent of the population, faced severe consequences due to inadequate sanitation, highlighting a troubling disparity compared to countries like Vietnam, China, and Thailand, where only 8 percent, 5 percent, and 1 percent of their populations lack these services. The global average is about 6 percent, underscoring the need for collaborative efforts to improve sanitation access in underserved regions of Sub-Saharan Africa, where immediate action can foster meaningful change.

Kenya – Proportion of rural population not served with at least basic sanitation: A Global Perspective
In 2022, nearly 25 million people in rural Kenya, or 65 perecent of this population, faced a critical crisis due to a lack of access to basic sanitation facilities, revealing a significant disparity with countries like Vietnam, Sri Lanka, and Thailand, which reported access rates of 12 percent, 5 percent, and 2 percent respectively. This sanitation crisis is more than just numbers; it represents a serious public health emergency that affects countless lives and demands our immediate action, as inadequate sanitation leads to tragic yearly fatalities and exacerbates an ongoing health crisis. Safe sanitation is not merely a convenience; it is a fundamental human right that everyone deserves, urging us to advocate for this essential right throughout Sub-Saharan Africa, where urgent action is critical for enhancing community health, dignity, and overall well-being for all those affected.

Kenya-Water Supply
Kenya – Proportion of total population served with at least basic water
In 2022, proportion of population served with at least basic water for Kenya was 62.8 %. Proportion of population served with at least basic water of Kenya increased from 47.5 % in 2000 to 62.9 % in 2022 an absolute change of 15.4 pp between 2000 and 2022.
Kenya – Proportion of urban population served with at least basic water
In 2022, proportion of urban population served with at least basic water for Kenya was 86.4 %. Proportion of urban population served with at least basic water of Kenya fell gradually from 87.8 % in 2000 to 86.4 % in 2022 an absolute change of 1.4 pp between 2000 and 2022.
Kenya – Proportion of rural population with at least basic water
In 2022, proportion of rural population served with at least basic water for Kenya was 53.2 %. Proportion of rural population served with at least basic water of Kenya increased from 37.5 % in 2000 to 53.3 % in 2022 an absolute change of 15.8 pp between 2000 and 2022.
Kenya- Proportion of population served with at least basic drinking water: A Global Perspective
Access to safe drinking water is a fundamental human right that demands our immediate collective action. In 2022, nearly 20 million people in Kenya, about 37% of the population, were without this essential resource, highlighting a pressing public health crisis. This situation starkly contrasts with the access enjoyed by every individual in Thailand and 98% of populations in Vietnam and Bangladesh. Such disparities underscore the urgent need for transformative change in Sub-Saharan Africa, where many still lack basic resources to improve their quality of life. We must unite to ensure every person can access the safe drinking water they deserve, as this is our shared ethical responsibility in pursuit of a healthier and more equitable world for all.

Kenya – Proportion of rural population served with at least basic sanitation: A Global Perspective
In 2022, it is concerning that 47 percent of Kenya’s rural population, about 18 million people, still do not have access to safe drinking water, which requires immediate attention. In contrast, countries like Thailand, Bangladesh, and Vietnam have made significant progress, with nearly all rural residents having access to safe water at rates of 100 percent, 98 percent, and 97 percent respectively. This gap points to governance issues in many Sub-Saharan African countries and emphasizes the need for teamwork to enhance living conditions. It is vital to ensure that vulnerable communities receive the fundamental resources they need, as the lack of safe drinking water greatly impacts their health, economic growth, and overall well-being.

Kenya-Access to Electricity
Kenya-Proportion of population with access to electricity
In 2022, proportion of population with access to electricity for Kenya was 76 % in 2022. The proportion of population with access to electricity of Kenya increased from 15.2% in 2000 to 76% in 2022, an absolute change of 60.8 pp between 2000 and 2022.
Kenya-Proportion of urban population with access to electricity
In 2022, proportion of urban population with access to electricity for Kenya was 987%. The proportion of urban population with access to electricity of Kenya increased from 49.9% % in 2000 to 98% in 2022, an absolute change of 48.1 pp between 2000 and 2022.
Kenya-Proportion of rural population with access to electricity (% of rural population)
In 2022, proportion of rural population with access to electricity for Kenya was 65.2 %. The proportion of rural population with access to electricity of Kenya increased from 6.6% in 2000 to 65.6% in 2022, an absolute change of 59.6 pp between 2000 and 2022.
Kenya-Proportion of population with access to electricity: A Global Perspective
In 2022, approximately 24 percent of Kenya’s population lacked electricity, affecting over 13 million people who depend on this crucial service for survival and daily activities. This stark reality contrasts with the progress of countries like Vietnam and Malaysia in achieving universal electricity access, highlighting the urgent need for systemic change in Sub-Saharan Africa to enhance quality of life. The absence of reliable electricity not only causes significant inconveniences but also stunts development, healthcare, education, and economic opportunities, all essential for improving living standards and fostering a sustainable future in Kenya. This situation calls for targeted interventions and ongoing efforts to close the energy access gap.

Kenya – Kenya-Proportion of rural population with access to electricity: A Global Perspective
In 2022, 35 percent of Kenya’s rural population, nearly 13 million people, lived without electricity, highlighting a stark contrast to countries like Vietnam, Thailand, and Sri Lanka, where all rural residents have full access to this essential resource. In comparison, India and Bangladesh boast that 99 percent of their rural populations enjoy reliable electricity. These figures underscore the urgent need for governance reforms across Sub-Saharan Africa to ensure every community has access to electricity, enabling them to thrive and work towards a sustainable future.

Kenya: Health outcomes
Kenya-Life expectancy: A Global Perspective
Kenya’s life expectancy illustrates advancements and enduring challenges in Sub-Saharan Africa. While the global average life expectancy has escalated from 47 years in 1950 to 71 years in 2021, Kenya’s figures have risen from 49 years in 1960 to 62 years in 2022. This disparity is further accentuated when juxtaposed with nations such as South Korea and the Maldives, where life expectancy has surged from 54 years and 39 years, respectively, in 1960 to 83 years and 81 years in 2022. The circumstances in Kenya transcend mere statistical representation; they encapsulate an ongoing struggle against poverty, inadequate healthcare, and issues of governance. Acknowledging these disparities necessitates our commitment to transformative initiatives that empower all communities to partake in the benefits of global progress.

Kenya-Mortality rate, under-5 (per 1,000 live births): A Global Perspective
Kenya’s under-five mortality rate has notably declined in recent decades, reflecting the dedication of communities working to improve child health outcomes. Since 1950, global efforts to reduce child mortality have gained momentum, driven by better living standards, improved access to healthcare, enhanced nutrition, and safe drinking water. In wealthier regions like Europe and North America, child mortality rates have fallen below four percent, showcasing the benefits of robust healthcare systems. Despite progress in many developing nations, advancements in Sub-Saharan Africa, particularly Kenya, remain inconsistent. The under-five mortality rate in Kenya has reduced from 109 in 1980 to 41 in 2022, yet challenges persist. In contrast, countries such as Bangladesh and India have seen remarkable drops in mortality rates, highlighting the urgent need for effective governance and healthcare reform in Kenya. It is vital for the global community to unite in investing in sustainable initiatives that prioritize vulnerable populations, ensuring every child has the chance for a healthy future.

Kenya-Maternal mortality ratio (per 100,000 live births): A Global Perspective
Kenya’s maternal mortality ratio has seen a modest decline from 564 in 2000 to 530 in 2020, yet it remains unacceptably high, revealing the persistent challenges that mothers encounter each day. This improvement starkly contrasts with the significantly lower rates in Bangladesh, India, and Vietnam, which reported figures of 123, 103, and 46 in 2022. The crisis of pregnancy-related deaths is exacerbated by high birth rates and ongoing maternal health issues, necessitating immediate intervention. These statistics expose critical deficiencies in the healthcare system and the chronic underfunding plaguing many Sub-Saharan African nations. The disparities in maternal health outcomes compared to other developing regions highlight the urgent need for substantial investment in health infrastructure and resources to enhance maternal health services, eliminate barriers, and mobilize support to ensure that mothers and children flourish in a safe environment, paving the way for a healthier future for all in Sub-Saharan Africa.
