Ethiopia
Country Flag Details
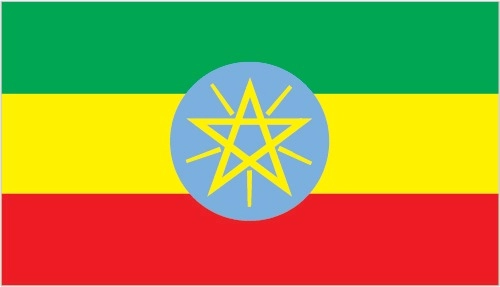
three equal horizontal bands of green (top), yellow, and red, with a yellow pentagram and single yellow rays emanating from the angles between the points on a light blue disk centered on the three bands; green represents hope and the fertility of the land, yellow symbolizes justice and harmony, while red stands for sacrifice and heroism in the defense of the land; the blue of the disk symbolizes peace and the pentagram represents the unity and equality of the nationalities and peoples of Ethiopia
note: Ethiopia is the oldest independent country in Africa, and the three main colors of her flag (adopted ca. 1895) were so often appropriated by other African countries upon independence that they became known as the Pan-African colors; the emblem in the center of the current flag was added in 1996.
Background
Unique among African countries, the ancient Ethiopian monarchy maintained its freedom from colonial rule with the exception of a short-lived Italian occupation from 1936-41. In recent years, Ethiopia has experienced periods of ethnic-based violence.
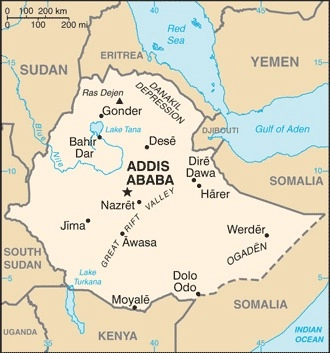
Geography
Area
total : 1,104,300 sq km
land: 1,096,570 sq km
water: 7,730 sq km
Climate
tropical monsoon with wide topographic-induced variation
Natural resources
small reserves of gold, platinum, copper, potash, natural gas, hydropower
People and Society
Population
total: 118,550,298
Ethnic groups
Oromo 35.8%, Amhara 24.1%, Somali 7.2%, Tigray 5.7%, Sidama 4.1%, Guragie 2.6%, Welaita 2.3%, Afar 2.2%, Silte 1.3%, Kefficho 1.2%, other 13.5% (2022 est.)
Languages
Oromo (official regional working language) 33.8%, Amharic (official national language) 29.3%, Somali (official regional working language) 6.2%, Tigrigna (Tigrinya) (official regional working language) 5.9%, Sidamo 4%, Wolaytta 2.2%, Gurage 2%, Afar (official regional working language) 1.7%, Hadiyya 1.7%, Gamo 1.5%, Gedeo 1.3%, Opuuo 1.2%, Kafa 1.1%, other 8.1%, English (2007 est.)
Religions
Ethiopian Orthodox 43.8%, Muslim 31.3%, Protestant 22.8%, Catholic 0.7%, traditional 0.6%, other 0.8% (2016 est.)
Population growth rate
2.37% (2024 est.)
Government
Government type
federal parliamentary republic
Capital name: Addis Ababa
Executive branch
chief of state: President TAYE Atske Selassie (since 7 October 2024)
head of government: Prime Minister ABIY Ahmed Ali (since April 2018)
Economy
Economic overview
low-income, fast-growing Horn of Africa economy; widespread poverty and food insecurity worsened by conflict and environmental factors; landlocked with tensions over seaport access; development aid supporting reforms to boost private-sector growth and financial stability; challenge of creating jobs for growing labor force
Real GDP (purchasing power parity)
$354.604 billion (2023 est.)
$332.968 billion (2022 est.)
$316.145 billion (2021 est.)
Real GDP per capita
$2,800 (2023 est.)
$2,700 (2022 est.)
$2,600 (2021 est.)
Exports
$10.865 billion (2023 est.)
$10.971 billion (2022 est.)
$9.496 billion (2021 est.)
Exports – partners
USA 12%, China 10%, UAE 8%, Saudi Arabia 8%, Netherlands 5% (2023)
Exports – commodities
coffee, garments, dried legumes, cut flowers, oil seeds (2023)
Imports
$22.951 billion (2023 est.)
$24.187 billion (2022 est.)
$20.859 billion (2021 est.)
Imports – partners
China 26%, Djibouti 16%, India 7%, Kuwait 7%, Saudi Arabia 6% (2023)
Imports – commodities
refined petroleum, fertilizers, plastics, raw sugar, cars (2023)
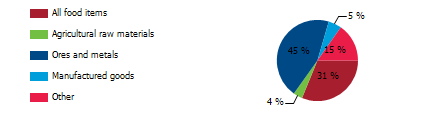
Export structure by product group (% of total exports) (UNCTAD)
The export structure of a nation illustrates the variety, composition, and monetary value of its internationally traded goods and services, providing vital insights into the country’s economic health, competitive position, and level of development. In Ethiopia’s case, the export economy is primarily defined by the agricultural sector, which plays a crucial role in its trade landscape. However, there is a noticeable shift as the country actively pursues strategies aimed at diversifying its economic portfolio, gradually enhancing its focus on industrial and service-oriented exports. This ongoing transition reflects Ethiopia’s commitment to achieving a more balanced and resilient export structure, ultimately contributing to its broader economic growth and development objectives.
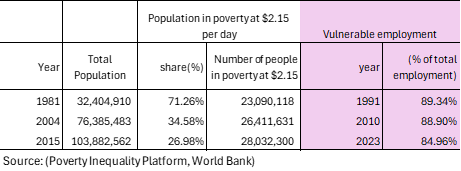
Poverty and vulnerable employment in Ethiopia
In 2023, approximately 85 percent of total employment in Ethiopia was identified as vulnerable employment, a term that refers to work marked by insufficient job security, low wages, and the lack of essential social protections such as health insurance, pensions, or labor rights. This category primarily includes own-account workers who operate independently without employees, like street vendors and small-scale farmers, as well as contributing family workers who assist in family businesses or farms without formal compensation. The nature of these jobs is often informal and unstable, lacking crucial benefits, which makes workers particularly vulnerable to economic fluctuations, exploitation, and poverty. The ramifications of such employment extend beyond the individual, affecting families and communities and perpetuating cycles of instability and hardship that are difficult to overcome.
Understanding poverty level significance at $2.15 per day
In 2015, 27 percent of Ethiopia’s population ( 28 million people) was identified as living in poverty at an income threshold of $ 2.15 per day. The poverty level at $2.15 per day (measured in 2017 purchasing power parity, or PPP) is a key global benchmark used by the World Bank to define extreme poverty in low-income countries. It indicates:
1. Basic Survival Threshold
• People living below $2.15 per day struggle to afford essential needs such as food, clean water, shelter, healthcare, and education.
2. Economic Underdevelopment
• A high percentage of a country’s population living below this threshold suggests low economic productivity, high unemployment, and weak social safety nets.
3. Inequality and Social Vulnerability
• It reflects deep income inequality and a lack of access to opportunities for upward mobility.
• People in this category are more vulnerable to shocks like food price increases, climate disasters, or health crises.
4. Policy Challenges
• Governments need targeted interventions such as social welfare programs, job creation, and improved access to education and healthcare to reduce poverty.
A country's export structure is a reflection of its level of development and productive capacities
The export structure of a country refers to the composition, diversity, and value of the goods and services it sells to other countries. It provides key insights into the country’s economic health, competitiveness, and level of development. Productive capacities of a country refer to its ability to produce goods and services efficiently and sustainably over time. These capacities are shaped by various factors, including human capital, natural resources, infrastructure, private sector, development, technology & innovation, institutions & governance, financial systems trade & market access.
Here’s what the export structure and productive capacities of a country typically indicate:
- Level of Economic Development
- Developed economies usually export high-value manufactured goods, technology, and services.
- Developing economies often rely on raw materials, agricultural products, or low-value manufactured goods.
- Industrial and Sectoral Strengths
- A strong presence of high-tech or industrial goods (e.g., machinery, electronics) suggests a well-developed manufacturing sector.
- A dominance of commodities (e.g., oil, minerals, agricultural products) indicates reliance on natural resources.
- Export Diversification
- A diverse export base (multiple industries) makes a country’s economy more stable and resilient to global price shocks.
- A concentrated export base (few key products) makes it vulnerable to market fluctuations.
- Trade Partnerships and Dependence
- If exports are heavily dependent on a single country or region, the economy is more exposed to geopolitical and trade risks.
- A wide range of trading partners indicates stronger global integration.
- Competitiveness and Value Addition
- Exporting mainly raw materials (e.g., crude oil instead of refined petroleum) suggests limited industrial processing capacity.
- A high share of finished and high-tech goods suggests strong value addition and competitiveness.
Ethiopia -Sanitation
Ethiopia – Proportion of population served with at least basic sanitation
In 2022, proportion of population served with at least basic sanitation for Ethiopia was 9.3 %. The proportion of population served with at least basic sanitation in Ethiopia increased from 2.8 % in 2000 to 9.3 % in 2022 an absolute increase of 6.5 percentage points (pp) between 2000 and 2022.
Ethiopia – Proportion of urban population served with at least basic sanitation
In 2022, the proportion of urban population served with at least basic sanitation for Ethiopia was 22.3 %. The proportion of urban population served with at least basic sanitation of Ethiopia increased from 15.0 % in 2000 to 22.3 % in 2022 an absolute increase of 7.3 pp between 2000 and 2022.
Ethiopia – Proportion of rural population served with at least basic sanitation
In 2022, the proportion of rural population served with at least basic sanitation for Ethiopia was 5.5 %. The proportion of rural population served with at least basic sanitation of Ethiopia increased from 0.7 % in 2000 to 5.5 % in 2022 an absolute increase of 4.8 pp between 2000 and 2022.
Ethiopia – Proportion of population served with at least basic sanitation: A Global Perspective
The ongoing shortage of safe sanitation in Ethiopia poses a serious challenge that urgently calls for our collective action, leading to preventable deaths for hundreds of thousands each year and highlighting a major public health crisis. Access to safe sanitation is a fundamental human right that must be guaranteed for everyone. In 2022, nearly 102 million people, or about 81 percent of Ethiopia’s population, suffered from inadequate sanitation facilities, in stark contrast to countries like Vietnam, China, and Thailand, where only 8 percent, 5 percent, and 1 percent respectively lack these essential services. The global average for individuals without proper sanitation is around 6 percent, emphasizing the urgent need for coordinated efforts to improve sanitation access in underserved regions of Sub-Saharan Africa, as the struggle for safe sanitation is crucial to social and economic development and human dignity.

Ethiopia – Proportion of rural population served with at least basic sanitation
In 2022, approximately 91 million individuals in rural Ethiopia, which represents about 94 percent of the population, did not have access to basic sanitation, a stark contrast to 12 percent in Vietnam, 5 percent in Sri Lanka, and just 2 percent in Thailand. This lack of safe sanitation presents a critical challenge that demands our immediate and unified response. Safe sanitation is not just a necessity; it is a fundamental human right vital for health and dignity. We must come together to champion this right throughout Sub-Saharan Africa, where the urgency for change is crucial for the well-being of all those affected.

Ethiopia-Water Supply
Ethiopia – Proportion of total population served with at least basic water
In 2022, the proportion of population served with at least basic drinking water for Ethiopia was 51.5 %. The proportion of population served with at least basic water in Ethiopia increased from 18.7 % in 2000 to 51.5 % in 2022 an absolute change of 32.8 pp between 2000 and 2022.
Ethiopia – Proportion of urban population served with at least basic water
In 2022, the proportion of the urban population served with at least basic water for Ethiopia was 83.2 %. The proportion of urban population served with at least basic water in Ethiopia increased from 76.2 % in 2000 to 83.2 % in 2022 an absolute increase of 7 pp between 2000 and 2022.
Ethiopia – Proportion of rural population with at least basic water
In 2022, the proportion of the rural population served with at least basic water for Ethiopia was 42.2 %. The roportion of the rural population served with at least basic water in Ethiopia increased from 8.7 % in 2000 to 42.2 % in 2022 an absolute change of 33.5 pp between 2000 and 2022.
Ethiopia- Proportion of population served with at least basic drinking water: A Global Perspective
Ethiopia is grappling with a critical challenge in delivering safe drinking water, impacting approximately 66 million people, which constitutes 48 percent of the population as of 2022. This alarming situation starkly contrasts with nations such as Thailand, where universal access to clean water is standard, and diverges from Vietnam and Bangladesh, both of which boast access rates of 98 percent. These disparities highlight the urgent need for comprehensive reforms across Sub-Saharan Africa, where countless individuals still lack the vital resources necessary for improving their quality of life. Tackling this issue demands collective action and steadfast dedication, as providing access to safe drinking water is not only a logistical hurdle but also a moral obligation essential for fostering equitable and sustainable development.

Ethiopia- Proportion of rural population served with at least basic drinking water: A Global Perspective
In 2022, it is alarming that 58 percent of Ethiopia’s rural population, around 56 million people, lacked access to safe drinking water, highlighting a severe humanitarian crisis that requires urgent action. This situation is starkly different from the near-universal access seen in countries like Thailand, Bangladesh, and Vietnam. Such a disparity underscores the governance challenges many Sub-Saharan African nations face and emphasizes the critical need for coordinated efforts to improve living conditions. It is vital to provide essential resources to vulnerable communities disproportionately affected by these inequities, as doing so is essential for promoting sustainable development and enhancing well-being in the region.

Ethiopia-Access to Electricity
Ethiopia-Access to electricity (% of population)
In 2022, the proportion of population with access to electricity for Ethiopia was 55 % in 2022. The proportion of population with access to electricity in Ethiopia increased from 12.7% in 2000 to 55% in 2022, an absolute change of 42.3 pp between 2000 and 2022.
Burundi-Access to electricity (% urban population)
In 2022, the proportion of the urban population with access to electricity for Ethiopia was 94%. The proportion of the urban population with access to electricity in Ethiopia increased from 76.2% % in 2000 to 94% in 2022, an absolute change of 17.8 pp between 2000 and 2022.
Ethiopia-Access to electricity (% of rural population)
In 2022, proportion of rural population with access to electricity for Ethiopia was 43 %. The proportion of rural population with access to electricity of Ethiopia increased from 1.7 % in 2000 to 43% in 2022, an absolute change of 41.3 pp between 2000 and 2022.
Ethiopia- Proportion of population with access to electricity: A Global Perspective
In 2022 nearly 45 percent of Ethiopia’s population lived without access to electricity affecting over 56 million people and hindering their survival and daily activities. This situation sharply contrasts with countries like Vietnam and Thailand that have achieved universal electricity access illustrating the urgent need for change throughout Sub-Saharan Africa. The absence of reliable electricity is not just inconvenient; it obstructs development health education and economic opportunities vital for improving living standards and fostering hope for a sustainable future. Furthermore the lack of electricity stifles innovation and entrepreneurial efforts perpetuating a cycle of poverty that is hard to break. Access to electricity is not merely about comfort; it is a fundamental necessity that can unlock potential growth and advancement empowering communities to achieve their aspirations for a better quality of life.

Ethiopia- Proportion of rural population with access to electricity: A Global Perspective
In 2022, an alarming 57 percent of Ethiopia’s rural population, nearly 55 million people, endured life without electricity, highlighting a stark disparity compared to countries like Vietnam, Thailand, and Sri Lanka, where all rural residents have access to this vital resource. In India and Bangladesh, an impressive 99 percent of rural communities enjoy reliable electricity. These statistics emphasize the urgent need for transformative governance reforms throughout Sub-Saharan Africa, essential for ensuring dependable electricity access and empowering communities to build a sustainable, equitable, and hopeful future, where individuals can leverage modern energy to enhance their development.

Ethiopia: Health outcomes
Ethiopia-Life expectancy: A Global Perspective
Ethiopia’s health outcomes provide crucial insights into life expectancy trends globally over the last seventy years, revealing both progress and ongoing challenges. While many regions have made notable advances in promoting healthier lives, the disparities in Sub-Saharan Africa remain alarming. The global average life expectancy for newborns increased from 47 years in 1950 to 71 years in 2021, yet Ethiopia saw only a modest rise from 40 years in 1960 to 66 years in 2022. This contrasts sharply with countries like South Korea, which improved from 54 years in 1960 to 83 years in 2022, and the Maldives, which rose from 39 years in 1960 to 81 years in 2022. The low life expectancy in many Sub-Saharan African nations highlights deep-rooted issues such as poverty and inadequate healthcare, underscoring the urgent need for innovative actions to create a fair and sustainable future for these communities, ensuring that global progress benefits all populations.

Ethiopia-Mortality rate, under-5 (per 1,000 live births): A Global Perspective
Ethiopia has made notable strides in reducing its under-five mortality rate, which fell from 241 in 1980 to 46 in 2022, reflecting the resilience of its communities facing ongoing challenges. This progress is part of a global initiative to lower child mortality that began in 1950, driven by improved living conditions, healthcare access, nutrition, and clean water. While wealthy nations in Europe and America have achieved child mortality rates below 4 percent, many Sub-Saharan African countries, including Ethiopia, encounter complex barriers to faster improvements. In contrast, Bangladesh and India have seen their rates drop from 206 and 169 in 1980 to just 29 in 2022. These figures highlight the urgent need for healthcare reforms and effective governance in Sub-Saharan Africa to address child mortality and promote the well-being of vulnerable populations, emphasizing the importance of international collaboration and investment in sustainable health initiatives for meaningful change.

Ethiopia-Maternal mortality ratio (per 100,000 live births): A Global Perspective
Ethiopia has made commendable progress in reducing its maternal mortality ratio from 953 in 2000 to 367 in 2020; however, this improvement is tragically insufficient as the rate remains alarmingly high, reflecting the ongoing challenges mothers face across the country. These advancements are starkly contrasted by the significantly lower rates in Bangladesh, India, and Vietnam, which reported 123, 103, and 46 respectively in 2022. These statistics reveal severe shortcomings in healthcare systems and the chronic underfunding affecting many Sub-Saharan African nations, highlighting the critical need for immediate action and investment in health infrastructure to protect the well-being of mothers and their children in Ethiopia.
