Chad
three equal vertical bands of blue (hoist side), gold, and red; the flag combines the blue and red French (former colonial) colors with the red and yellow (gold) of the Pan-African colors; blue symbolizes the sky, hope, and the south of the country, which is relatively well-watered; gold represents the sun, as well as the desert in the north of the country; red stands for progress, unity, and sacrifice
note: almost identical to the flag of Romania but with a darker shade of blue; also similar to the flags of Andorra and Moldova, both of which have a national coat of arms centered in the yellow band; design based on the flag of France.
Background
Chad, part of France’s African holdings until 1960, endured six decades of internal conflicts with armed rebel groups, including a period of civil war in 1979-1982 and a Libyan invasion in the 1980s. The government eventually drafted a democratic constitution but has held flawed presidential elections since 1996. The country has struggled with poverty, a weak economy, and terrorist insurgencies.
Geography
Area
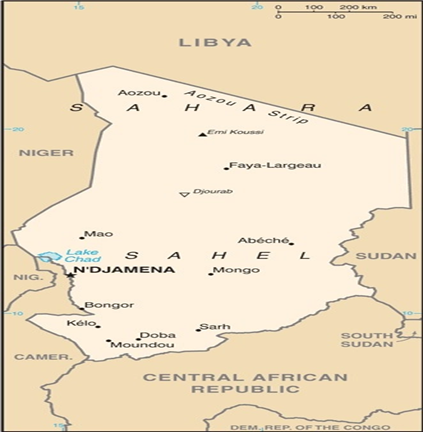
total : 1.284 million sq km
land: 1,259,200 sq km
water: 24,800 sq km
Climate
tropical in south, desert in north
Natural resources
petroleum, uranium, natron, kaolin, fish (Lake Chad), gold, limestone, sand and gravel, salt
People and Society
Population
total: 19,093,595
Ethnic groups
Sara (Ngambaye/Sara/Madjingaye/Mbaye) 30.5%, Kanembu/Bornu/Buduma 9.8%, Arab 9.7%, Wadai/Maba/Masalit/Mimi 7%, Gorane 5.8%, Masa/Musseye/Musgum 4.9%, Bulala/Medogo/Kuka 3.7%, Marba/Lele/Mesme 3.5%, Mundang 2.7%, Bidiyo/Migaama/Kenga/Dangleat 2.5%, Dadjo/Kibet/Muro 2.4%, Tupuri/Kera 2%, Gabri/Kabalaye/Nanchere/Somrai 2%, Fulani/Fulbe/Bodore 1.8%, Karo/Zime/Peve 1.3%, Baguirmi/Barma 1.2%, Zaghawa/Bideyat/Kobe 1.1%, Tama/Assongori/Mararit 1.1%, Mesmedje/Massalat/Kadjakse 0.8%, other 4.6%, unspecified 1.7% (2014-15 est.)
Languages
French (official), Arabic (official), Sara (in south), more than 120 languages and dialects
Religions
Muslim 52.1%, Protestant 23.9%, Roman Catholic 20%, animist 0.3%, other Christian 0.2%, none 2.8%, unspecified 0.7% (2014-15 est.)
Population growth rate
3.01% (2024 est.)
Government
Government type
presidential republic
Capital
name: N’Djamena
Executive branch
chief of state: President Mahamat Idriss DÉBY (since 6 May 2024)
head of government: Prime Minister Allamaye HALINA (since 23 May 2024)
Economy
Real GDP (purchasing power parity)
$32.446 billion (2023 est.)
$31.161 billion (2022 est.)
$30.311 billion (2021 est.)
Real GDP per capita
$1,700 (2023 est.)
$1,700 (2022 est.)
$1,700 (2021 est.)
Exports
$6.503 billion (2022 est.)
$4.565 billion (2021 est.)
$2.863 billion (2020 est.)
Exports – partners
UAE 26%, China 19%, Germany 17%, Netherlands 13%, France 10% (2023)
Exports – commodities
crude petroleum, gold, oil seeds, gum resins, cotton (2023)
Imports
$5.028 billion (2022 est.)
$5.211 billion (2021 est.)
$4.502 billion (2020 est.)
Imports – partners
China 28%, UAE 23%, Turkey 10%, France 9%, India 5% (2023)
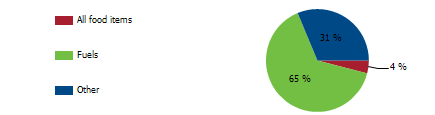
Imports – commodities
jewelry, broadcasting equipment, packaged medicine, cars, refined petroleum (2023)
Export structure by product group in 2023 (% of total exports) (UNCTAD)
The export structure of a country serves as a vital indicator of the variety, composition, and value of its goods and services traded on the international stage, offering essential insights into the nation’s economic vitality, competitiveness, and overall level of development. In the case of Chad, the export landscape is predominantly shaped by the lucrative sectors of crude petroleum and gold, while agricultural products such as oily seeds, gum arabic, and cotton contribute crucially, albeit in a complementary manner. A significant objective remains the diversification of this export base, as it is imperative for fostering sustainable economic growth and enhancing resilience against potential external shocks that could threaten the economy.
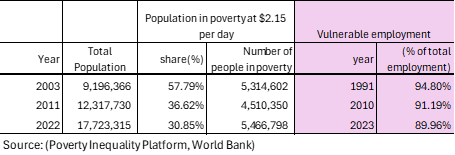
Poverty and vulnerable employment in Chad (World Bank)
In 2023, nearly 90 percent of total employment was characterized as vulnerable employment, defined by inadequate job security, low wages, and a lack of essential social protections such as health insurance, pensions, and labor rights. This category primarily includes self-employed individuals without employees, such as street vendors and small-scale farmers, along with family members who contribute to family businesses or farms without formal payment. These roles often exist within the informal economy and are characterized by instability and a complete absence of benefits, leaving workers in precarious situations susceptible to economic downturns, exploitation, and the ongoing risk of falling into poverty. The consequences of this form of employment extend beyond individual workers, impacting families and communities and perpetuating cycles of instability and hardship that are challenging to escape.
Understanding poverty level significance at $2.15 per day
In 2022, over 5 million people in Chad lived in poverty at $2.15 per day. The poverty level at $2.15 per day (measured in 2017 purchasing power parity, or PPP) is a key global benchmark used by the World Bank to define extreme poverty in low-income countries. It indicates:
1. Basic Survival Threshold
• People living below $2.15 per day struggle to afford essential needs such as food, clean water, shelter, healthcare, and education.
2. Economic Underdevelopment
• A high percentage of a country’s population living below this threshold suggests low economic productivity, high unemployment, and weak social safety nets.
3. Inequality and Social Vulnerability
• It reflects deep income inequality and a lack of access to opportunities for upward mobility.
• People in this category are more vulnerable to shocks like food price increases, climate disasters, or health crises.
4. Policy Challenges
• Governments need targeted interventions such as social welfare programs, job creation, and improved access to education and healthcare to reduce poverty.
.
A country's export structure is a reflection of its level of development and productive capacities
The export structure of a country refers to the composition, diversity, and value of the goods and services it sells to other countries. It provides key insights into the country’s economic health, competitiveness, and level of development. Productive capacities of a country refer to its ability to produce goods and services efficiently and sustainably over time. These capacities are shaped by various factors, including human capital, natural resources, infrastructure, private sector, development, technology & innovation, institutions & governance, financial systems trade & market access.
Here’s what the export structure and productive capacities of a country typically indicate:
- Level of Economic Development
- Developed economies usually export high-value manufactured goods, technology, and services.
- Developing economies often rely on raw materials, agricultural products, or low-value manufactured goods.
- Industrial and Sectoral Strengths
- A strong presence of high-tech or industrial goods (e.g., machinery, electronics) suggests a well-developed manufacturing sector.
- A dominance of commodities (e.g., oil, minerals, agricultural products) indicates reliance on natural resources.
- Export Diversification
- A diverse export base (multiple industries) makes a country’s economy more stable and resilient to global price shocks.
- A concentrated export base (few key products) makes it vulnerable to market fluctuations.
- Trade Partnerships and Dependence
- If exports are heavily dependent on a single country or region, the economy is more exposed to geopolitical and trade risks.
- A wide range of trading partners indicates stronger global integration.
- Competitiveness and Value Addition
- Exporting mainly raw materials (e.g., crude oil instead of refined petroleum) suggests limited industrial processing capacity.
- A high share of finished and high-tech goods suggests strong value addition and competitiveness.
Chad-Sanitation
Chad- Proportion of population served with at least basic sanitation
In 2022, the proportion of the population served with at least basic sanitation for Chad was 12.9 %. Proportion of population served with at least basic sanitation of Chad increased from 9.7 % in 2000 to 12.9 % in 2022 an absolute change of 3.2 percentage points (pp) increase between 2000 and 2022.
Chad – Proportion of urban population served with at least basic sanitation
In 2022, the proportion of the urban population served with at least basic sanitation for Chad was 39.5%. The proportion of urban population served with at least basic sanitation of Chad increased from 22.7 % in 2000 to 39.5 % in 2022 an absolute change of 16.8 pp increase between 2000 and 2022.
Cameroon – Proportion of rural population served with at least basic sanitation
In 2022, proportion of rural population served with at least basic sanitation for Cameroon was 4.5 %. Proportion of rural population served with at least basic sanitation of Chad fell gradually from 6.1 % in 2000 to 4.5 % in 2022, an absolute change of 1.6 pp decline between 2000 and 2022.
Chad – Proportion of population served with at least basic sanitation: A Global Perspective
In 2022, only 12.9% of the population in Chad had access to at least basic sanitation facilities, a figure that, although an improvement from 9.7% in 2000, underscores the persistent challenges the nation faces. In contrast, countries such as Thailand, Vietnam, and Sri Lanka achieved remarkable access rates of 99.0%, 92.2%, and 95.1%, respectively. Access to safe and adequate sanitation is more than just a statistic; it is a fundamental human right essential for health, dignity, and overall well-being. These striking figures highlight the pressing need for collective action to develop sustainable and inclusive solutions that ensure safe sanitation for every person across Sub-Saharan Africa. It is crucial that we come together to foster healthier and more resilient communities.

Chad- Proportion of the rural population with at least basic sanitation services: A Global Perspective
Unsafe sanitation is not just a statistic; it is a harrowing reality that affects millions of lives every year. Access to safe sanitation is not merely a basic necessity; it is a fundamental human right that we must collectively advocate for. Disturbingly, in 2022, only 4.5 percent of Chad’s rural population had access to at least basic sanitation services, a significant drop from 6.1 percent in 2000. This alarming trend is a clarion call for all of us to engage and push for change. In stark contrast, countries like Thailand, Indonesia, and Sri Lanka have seen impressive advancements, with 98.4 percent, 83.6 percent, and 94.9 percent of their rural populations enjoying access to sanitation facilities in 2022. These startling statistics highlight the severe disparities we face globally and the pressing need for transformative action across Sub-Saharan Africa.

Chad-Water Supply
Chad – Proportion of total population served with at least basic water
In 2022, the proportion of the population served with at least basic water in Chad was 52.0 %. The proportion of the population served with at least basic water in Chad increased from 36.6 % in 2000 to 52.0% in 2022, an absolute change of 15.4 pp between 2000 and 2022.
Chad – Proportion of urban population served with at least basic water
In 2022, the proportion of the urban population served with at least basic water in Chad was 77.9 %. The proportion of the urban population served with at least basic water in Chad increased from 74.4 % in 2000 to 77.9 % in 2022, an absolute change of 3.5 pp increase between 2000 and 2022.
Chad – Proportion of rural population with at least basic water
In 2022, the proportion of the rural population served with at least basic water for Chad was 43.8 %. The proportion of rural population served with at least basic water in Chad increased from 28.7 % in 2000 to 43.8 % in 2022 an absolute change of 15 pp between 2000 and 2022.
Chad. – Proportion of total population served with at least basic drinking water: A Global Perspective
In 2022, it was reported that an encouraging 52 percent of the population in Chad had access to at least basic water services, a significant increase from just 38.6 percent in 2000. However, this progress stands in stark contrast to the 100 percent access to safe drinking water experienced by populations in South Korea and Thailand, where clean water is considered a basic necessity rather than a privilege. These disparities in water accessibility go beyond mere statistics; they represent the real and urgent challenges faced by communities, affecting health, education, and overall quality of life. It is crucial that we recognize these inequalities and promote sustainable solutions along with strong infrastructure to ensure that every individual has the right to this vital resource, paving the way for a healthier and more equitable future for all.

Chad-Proportion of rural population with at least basic drinking water: A Global Perspective
In 2022, just 43.8% of the rural population in Chad had access to at least basic water services, a significant rise from 28.8% in 2000. This figure starkly contrasts with the access rates of rural populations in Bangladesh, Thailand, and Vietnam, which stood at 98.3%, 100%, and 97.2% respectively in 2022. Access to safe drinking water is an essential human right that must be guaranteed for all individuals. It is vital to highlight the importance of sustainable governance to ensure the long-term availability of this critical resource. Achieving this requires fostering collaborative partnerships among local communities, governmental bodies, and international organizations. We must unite in our efforts to create a future where every rural inhabitant can depend on reliable access to safe drinking water. It is our collective duty to champion initiatives that address present challenges while laying the groundwork for a more sustainable and equitable water future for everyone.

Chad-Access to Electricity
Chad- Access to Electricity (% of population)
In 2022, the proportion of the population with access to electricity in Chad was 11.7 %. The proportion of the population with access to electricity in Chad increased from 3.1% in 2000 to 11.7 % in 2022, an absolute change of 8.6 pp increasebetween 2000 and 2022.
Chad- Access to Electricity (% urban population)
In 2022, the proportion of the urban population with access to electricity in Chad was 46.3%. The proportion of the urban population with access to electricity in Chad increased from 10.1% % in 2000 to 46.3% in 2022, an absolute change of 36.2% increase between 2000 and 2022.
Cameroon- Access to Electricity (% rural population)
In 2022, the proportion of the rural population with access to electricity in Chad was 1.3 %. The proportion of the rural population with access to electricity in Chad increased from 1.2 % in 2000 to 1.3% in 2022, an absolute change of 0.1 pp increase between 2000 and 2015.
Chad – Total population with access to electricity: A Global Perspective
In 2022, only 11.7% of the population in Chad had access to electricity, a notable improvement from just 3.1% in 2000. This 8.6 pp increases over the past two decades showcases the resilience and determination of the people of Chad, yet it highlights the ongoing struggles many continue to endure in their daily lives. In contrast, countries like South Korea and Thailand have universal access to electricity at 100%, while the global average stands at an impressive 91.4%, revealing stark disparities in energy availability that hinder lives and limit economic opportunities. It is essential for governments, organizations, and communities to unite and tackle the pressing need for improved energy infrastructure in Chad. By working together, we can create a future where everyone has reliable access to electricity, enhancing their quality of life and unlocking new avenues for growth and development.

Chad- Rural population with access to electricity: A Global Perspective
As of 2022, only 1.3% of this population has reliable electricity, a slight increase from 1.2% in 2000. This figure starkly contrasts with other countries, such as South Korea and Thailand , where nearly 100% of rural residents enjoy consistent electricity access. This gap not only affects the quality of life for countless individuals but also hinders economic growth and development. It is imperative for all stakeholders—including government entities, NGOs, and the private sector—to unite and take meaningful steps toward improving energy infrastructure and accessibility in Chad. By working together, we can close this gap and empower communities, paving the way for a brighter and more sustainable future.

Chad-Health Outcomes
Chad-Life expectancy: A Global Perspective
The global average life expectancy for newborns has increased significantly, rising from 47 years in 1950 to 71 years by 2021; however, this trend reveals substantial variation across different regions. In Sub-Saharan Africa, improvements in life expectancy have progressed at a slower rate. For example, Chad has seen a modest rise from 38 years in 1960 to 53 years in 2022, while Morocco has experienced a remarkable advancement, with life expectancy soaring from 42 years in 1960 to 75 years in 2022. This stark contrast underscores the heterogeneous development among nations. A closer examination of the associated chart will provide deeper insights into the distinct trends that differentiate the countries of Sub-Saharan Africa from those in other developing regions.

Chad- Mortality Rate, under-5 (per 1,000 live births): A Global Perspective
The under-five mortality rate is a crucial indicator of the challenges faced by vulnerable populations. In 2022, Chad recorded a child mortality rate of 102.9 deaths per 1,000 live births, a significant drop from the alarming 240 in 1980. This improvement reflects ongoing efforts since 1950 to enhance living conditions, healthcare, nutrition, and access to clean water. While countries in Europe and North America boast rates below 4 percent, Sub-Saharan Africa still grapples with serious issues. In 1980, Chad and Bangladesh had high rates of 240 and 206, respectively, but by 2022, Bangladesh reduced its rate to 29, while Chad remains around 102.9. We invite you to review the detailed statistics in the chart and engage with our mission at WeUniteSSA to bridge the gap between Sub-Saharan Africa and other developing regions, ensuring a brighter future for every child.

Chad-Maternal mortality ratio (per 100,000): A Global Perspective
In 2020, Chad recorded a maternal mortality ratio of 835 deaths per 100,000 live births. This figure reflects a gradual decline from 1315 deaths per 100,000 live births in 2000. In stark contrast, countries such as China, Sri Lanka, and South Korea reported significantly lower maternal mortality rates, with figures of 23, 29, and 8 deaths per 100,000 live births, respectively, in 2022. The issue of maternal health is critical and demands urgent attention. It is essential to prioritize comprehensive healthcare services, education, and community support to ensure that every woman has access to the necessary care. By uniting and committing to maternal health initiatives, we can foster healthier families and contribute to a more sustainable future for Chad.
