Botswana
Country Flag Details
light blue with a horizontal white-edged black stripe in the center; the blue symbolizes water in the form of rain, while the black and white bands represent racial harmony.
Background
Formerly the British protectorate of Bechuanaland, Botswana adopted its new name at independence in 1966. More than five decades of uninterrupted civilian leadership, progressive social policies, and significant capital investment have created an enduring democracy and upper middle-income economy.
Geography
Area
total : 581,730 sq km
land: 566,730 sq km
water: 15,000 sq km
Climate
semiarid; warm winters and hot summers
Natural resources
diamonds, copper, nickel, salt, soda ash, potash, coal, iron ore, silver
People and Society
Population
total: 2,450,668
Ethnic groups
Tswana (or Setswana) 79%, Kalanga 11%, Basarwa 3%, other, including Kgalagadi and people of European ancestry 7%
Languages
Setswana 77.3%, Sekalanga 7.4%, Shekgalagadi 3.4%, English (official) 2.8%, Zezuru/Shona 2%, Sesarwa 1.7%, Sembukushu 1.6%, Ndebele 1%, other 2.8% (2011 est.)
Religions
Christian 79.1%, Badimo 4.1%, other 1.4% (includes Baha’i, Hindu, Muslim, Rastafarian), none 15.2%, unspecified 0.3% (2011 est.)
Population growth rate
1.34% (2024 est.)
Government
Government type
parliamentary republic
Capital name: Gaborone
Executive branch
chief of state: President Duma BOKO (since 1 November 2024)
head of government: President Duma BOKO (since 1 November 2024)
Economy
Economic overview
good economic governance and financial management; diamond-driven growth model declining; rapid poverty reductions; high unemployment, particularly among youth; COVID-19 sharply contracted the economy and recovery is slow; public sector wages have posed fiscal challenges
Real GDP (purchasing power parity)
$46.743 billion (2023 est.)
$45.499 billion (2022 est.)
$43.133 billion (2021 est.)
Real GDP per capita
$18,800 (2023 est.)
$18,600 (2022 est.)
$18,000 (2021 est.)
Exports
$6.398 billion (2023 est.)
$8.914 billion (2022 est.)
$7.861 billion (2021 est.)
Exports – partners
UAE 27%, India 17%, Belgium 16%, South Africa 8%, USA 7% (2023)
Exports – commodities
diamonds, copper ore, insulated wire, carbonates, cattle (2023)
Imports
$7.228 billion (2023 est.)
$8.826 billion (2022 est.)
$9.25 billion (2021 est.)
Imports – partners
South Africa 65%, Namibia 8%, Canada 5%, China 3%, India 3% (2023)
Imports – commodities
refined petroleum, diamonds, cars, flavored water, electricity (2023)
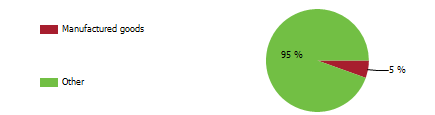
Export structure by product group in 2023 (% of total exports) (UNCTAD)
The export structure of a country serves as a vital indicator of the variety, composition, and monetary value of the goods and services it trades on an international scale, offering essential insights into the overall economic health, competitive stance, and developmental progress of the nation. In Botswana, while diamonds continue to play a predominant role in the export landscape, there is an increasingly recognized necessity to broaden the economic base. This shift towards diversification is crucial for fostering long-term stability and sustainable growth, enabling the country to better navigate global market fluctuations and reduce dependence on a single resource.
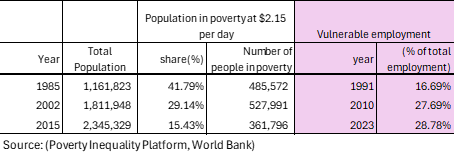
Poverty and vulnerable employment in Botswana (World Bank)
In 2023, a significant 29 percent of total employment in Botswana was categorized as vulnerable employment, which is marked by insufficient job security, low wages, and an alarming absence of crucial social protections such as health insurance, pensions, or labor rights. This category primarily encompasses own-account workers—individuals who are self-employed without any employees, including street vendors and small-scale farmers—and contributing family workers, who offer their labor in family-run businesses or farms without receiving any formal compensation. Such roles are predominantly informal and exceedingly unstable, lacking the essential benefits that safeguard workers, which renders them especially vulnerable to economic disruptions, exploitation, and the grip of poverty. The repercussions of this precarious employment situation extend well beyond the individuals engaged in it, affecting their families and entire communities, and perpetuating cycles of instability and hardship that are challenging to escape, thus contributing to broader societal issues that demand urgent attention and intervention.
Understanding poverty level significance at $2.15 per day
In 2015, 15 percent of the population in Botswana lived in poverty at $2.15 per day. The poverty level at $2.15 per day (measured in 2017 purchasing power parity, or PPP) is a key global benchmark used by the World Bank to define extreme poverty in low-income countries. It indicates:
1. Basic Survival Threshold
• People living below $2.15 per day struggle to afford essential needs such as food, clean water, shelter, healthcare, and education.
2. Economic Underdevelopment
• A high percentage of a country’s population living below this threshold suggests low economic productivity, high unemployment, and weak social safety nets.
3. Inequality and Social Vulnerability
• It reflects deep income inequality and a lack of access to opportunities for upward mobility.
• People in this category are more vulnerable to shocks like food price increases, climate disasters, or health crises.
4. Policy Challenges
• Governments need targeted interventions such as social welfare programs, job creation, and improved access to education and healthcare to reduce poverty.
A country's export structure is a reflection of its level of development and productive capacities
The export structure of a country refers to the composition, diversity, and value of the goods and services it sells to other countries. It provides key insights into the country’s economic health, competitiveness, and level of development. Productive capacities of a country refer to its ability to produce goods and services efficiently and sustainably over time. These capacities are shaped by various factors, including human capital, natural resources, infrastructure, private sector, development, technology & innovation, institutions & governance, financial systems trade & market access.
Here’s what the export structure and productive capacities of a country typically indicate:
- Level of Economic Development
- Developed economies usually export high-value manufactured goods, technology, and services.
- Developing economies often rely on raw materials, agricultural products, or low-value manufactured goods.
- Industrial and Sectoral Strengths
- A strong presence of high-tech or industrial goods (e.g., machinery, electronics) suggests a well-developed manufacturing sector.
- A dominance of commodities (e.g., oil, minerals, agricultural products) indicates reliance on natural resources.
- Export Diversification
- A diverse export base (multiple industries) makes a country’s economy more stable and resilient to global price shocks.
- A concentrated export base (few key products) makes it vulnerable to market fluctuations.
- Trade Partnerships and Dependence
- If exports are heavily dependent on a single country or region, the economy is more exposed to geopolitical and trade risks.
- A wide range of trading partners indicates stronger global integration.
- Competitiveness and Value Addition
- Exporting mainly raw materials (e.g., crude oil instead of refined petroleum) suggests limited industrial processing capacity.
- A high share of finished and high-tech goods suggests strong value addition and competitiveness.
Botswana-Sanitation
Botswana – Proportion of population served with at least basic sanitation
In 2022, the proportion of the population served with at least basic sanitation in Botswana was 80.6 %. Botswana’s population served with at least basic sanitation increased from 51.9 % in 2000 to 80.6 % in 2022, an absolute change of 28.7 percentage points (pp) between 2000 and 2022.
Botswana – Proportion of urban population served with at least basic sanitation facilities
In 2022, the proportion of the urban population served with at least basic sanitation for Botswana was 91.4 %. The proportion of the urban population served with at least basic sanitation in Botswana increased from 68.8 % in 2000 to 91.4 % in 2022, an absolute increase of 22.6 pp between 2000 and 2022.
Botswana – Proportion of rural population served with at least basic sanitation facilities
In 2022, the proportion of the rural population served with at least basic sanitation in Botswana was 52.4 %. The proportion of the rural population served with at least basic sanitation of Botswana increased from 32.7 % in 2003 to 52.4 % in 2022, an absolute change of 19.7 pp between 2000 and 2022.
Equatorial Guinea-Share of the population using at least basic sanitation facilities: A Global Perspective
Unsafe sanitation remains a critical issue that tragically results in the loss of countless lives each year. Access to safe sanitation is not merely a fundamental human necessity; it is a basic human right that every individual deserves. In 2022, the proportion of the population in Botswana with access to at least basic sanitation facilities was 80.6% , highlighting a significant gap in public health infrastructure. In stark contrast, nations such as China, Indonesia, Sri Lanka, Thailand, and Vietnam reported much higher access rates, with impressive figures reaching 95.9%, 88.2%, 95.1%, and 99.0%, respectively. The challenge of ensuring safe sanitation transcends mere statistics; it is a vital human right that is essential for health, dignity, and overall well-being. These alarming statistics emphasize the urgent need for collective action to promote sustainable governance and inclusive solutions that guarantee safe sanitation for every individual across Sub-Saharan Africa. (Refer to the chart below for a visual comparison that illustrates these disparities.)

Botswana- Share of the rural population served with at least basic sanitation: A Global Perspective
The chart below underscores a pressing concern: a significant portion of Botswana’s rural population lacks access to basic sanitation. This silent crisis impacts countless lives annually, highlighting the necessity of safe sanitation as a fundamental human right. In 2022, only 52.4% of the rural population had basic sanitation, starkly contrasting with Sri Lanka’s 94.9%, Thailand’s 98.4%, and Vietnam’s 88.4%. These statistics call for immediate action. United, we can work towards a future where safe sanitation is a reality for all, ultimately improving the quality of life for the rural population across Sub-Saharan Africa.

Botswana-Water Supply
Botswana – Proportion of population served with at least basic drinking water
In 2022, the proportion of the population served with at least basic drinking water in Botswana was 92.6 %. The proportion of the population served with at least basic drinking water in Botswana increased from 75.2 % in 2000 to 92.6 % in 2022 , an absolute change of 17.4 pp between 2000 and 2022
Botswana – Proportion of urban population served with at least basic water
In 2022, the % of the urban population served with at least basic sanitation in Botswana was 91.4 %. The proportion of the urban population served with at least basic sanitation in Botswana increased from 94.2% in 2000 to 97.5% in 2022, an absolute change of 3.3 pp between 2000 and 2022.
Botswana – Proportion of rural population served with at least basic water
In 2022, the % of the rural population served with at least basic sanitation in Botswana was 79.6 %. Proportion of rural population served with at least basic sanitation in Botswana increased from 53.5 % in 2000 to 79.6 % in 2022, an absolute change of 26.1 pp between 2000 and 2022.
Botswana – Proportion of Total Population Served with at Least Basic Water: A Global Perspective
As of 2022, 92.6% of Botswana’s population has access to basic drinking water services, a significant increase from 75.2% in 2000. However, this progress contrasts sharply with the 100% access in countries like South Korea and Thailand, where safe drinking water is assured. These differences highlight the real challenges communities face across Sub-Saharan Africa, affecting health, education, and overall quality of life. It is crucial to recognize these inequalities and advocate for sustainable solutions and infrastructure that ensure everyone has access to this essential resource.

Botswana – Share of the Rural Population Using at Least Basic Drinking Water Facilities
In 2022, 79.6% of the rural population in Botswana had access to at least basic drinking water services, a modest increase from 53.5% in the year 2000. This alarming trend starkly contrasts with the situation in countries like Vietnam, where access to safe drinking water is not just a luxury but a standard that is universally upheld. This glaring disparity highlights the urgent need for substantial improvements in infrastructure and resources, ensuring that every individual, regardless of their geographic location, can access the essential services they rightfully deserve. These disparities in water accessibility are not merely statistics; they represent profound challenges faced by communities, significantly impacting health, education, and the overall quality of life for countless individuals. It is imperative that we address these issues to foster a healthier and more equitable future for all in Sub-Saharan Africa.

Botswana-Access to Electricity
Botswana- Access to electricity (% of population)
In 2022, the proportion of the population with access to electricity in Botswana was 75.9%. The proportion of the population with access to electricity in Botswana increased from 26.5% in 2000 to 75.9% in 2022, an absolute change of 49.4 pp between 2000 and 2022.
Botswana- Access to Electricity (% urban population)
In 2022, the proportion of the urban population with access to electricity in Botswana was 95.5 %. The proportion of the urban population with access to electricity of Botswana increased from 39.2% % in 2000 to 95.5% in 2022, an absolute change of 56.3 pp between 2000 and 2022.
Botswana-Access to electricity (% rural population)
In 2022, proportion of rural population with access to electricity for Botswana was 25%. The proportion of rural population of Botswana with access to electricity of Botswana increased from 12.1 %in 2000 to 25% in 2022, an absolute decrease of 12.9% between 2000 and 2022.
Botswana- Access to Electricity as a Percentage of the Population: A Global Perspective.
In 2022, 75.9% of Botswana’s population had access to electricity, marking a notable increase from 26.5% in 2000. This progress, while commendable, still places Botswana behind many nations. For instance, countries like Thailand and South Korea have achieved 100% access to electricity, while Vietnam and Bangladesh are not far behind, nearing 99%. Access to electricity is not just a convenience; it is a fundamental necessity for alleviating poverty and fostering economic development. On a global scale, only 10 % of the world’s population lacked electricity in 2022. However, despite this overall advancement, several countries in Sub-Saharan Africa, including Botswana, continue to face significant challenges in achieving widespread electricity access.

Botswana-Access to electricity (% of the rural population): A Global Perspective
Access to electricity is a critical necessity that can transform lives, elevate communities from poverty, and drive economic growth. Measuring electricity access is essential for understanding social and economic progress. Over the past few decades, global electricity access has significantly increased; in 2000, 20 percent of the population lived without electricity, but this figure has now fallen to under 10 percent, largely due to advancements in low- and middle-income countries. However, the journey to universal access remains incomplete. In rural Botswana, only 25 percent had access to electricity in 2022, up from 12.1 percent in 2000, while rural populations in Vietnam, Thailand, South Korea, Malaysia, and China enjoy full access. This disparity underscores the urgent need for action and sustained support to ensure everyone can benefit from electricity.

Botswana: Health
Botswana-Life Expectancy: A Global Perspective
Over the past seventy years, global life expectancy has significantly improved, with the average for newborns rising from 47 years in 1950 to 71 years in 2021. This progress, however, has been uneven, particularly in Sub-Saharan Africa. For example, Botswana’s life expectancy increased from 50 years in 1960 to 66 years in 2022, demonstrating resilience amid challenges. In contrast, South Korea experienced remarkable growth, with life expectancy jumping from 54 years in 1960 to 83 years in 2022, while the Maldives saw an increase from 39 years in 1960 to 81 years in 2022. These figures underscore the disparities in health outcomes across regions.


Botswana- Maternal mortality ratio (per 100,000 births): A Global Perspective
Since 1950, the world has made tremendous progress in reducing maternal mortality, thanks to better living conditions, advancements in healthcare, improved nutrition, and access to clean drinking water. In the wealthiest nations of Europe and America, maternal mortality rates have plummeted considerably. Meanwhile, many developing countries across South America and Asia have also made significant strides in this area. However, the pace of change has been slower in many Sub-Saharan African nations. For instance, in 2000, Botswana and Bangladesh had maternal mortality ratio at 182 and 441, respectively. By 2022, these figures diverged dramatically, with Botswana’s maternal mortality ratio increasing from 182 in 2000 to 186 in 2022, while Bangladesh boasts a remarkable decline from 441in 2000 to just 123 in 2022, showcasing the progress made in Bangladesh. (Refer to the chart below for a virtual comparison).


Botswana-Mortality rate, under-5(per 1000 births): A Global Perspective
The chart below highlights the annual under-five mortality rates in various regions, revealing a concerning reality: many of these tragic deaths occur in Sub-Saharan Africa. This issue stems from factors like a high birth rate and ongoing under-five mortality challenges. For example, Bangladesh has made significant progress, reducing child mortality from 146 per 1,000 live births in 2000 to just 29 in 2022, demonstrating the benefits of better healthcare. In contrast, Botswana has seen only a slight decrease in under-five mortality, from 49.2 per 1,000 live births in 2000 to approximately 38.7 in 2022, emphasizing the urgent need for improved child health services in the country. A closer look at the chart below will offer a visual comparison of these important statistics.

