Benin
Country Flag Details: two equal horizontal bands of yellow (top) and red (bottom) with a vertical green band on the hoist side; green symbolizes hope and revival, yellow wealth, and red courage.
note: uses the popular Pan-African colors of Ethiopia
Background
Present-day Benin was the site of Dahomey, a West African kingdom that was a regional power from around 1600 through the mid -19th century. By 1894, France had taken control of the area. French Dahomey achieved independence in 1960 and changed its name to the Republic of Benin in 1975.
Geography
Area
total : 112,622 sq km
land: 110,622 sq km
water: 2,000 sq km
Climate
tropical; hot, humid in south; semiarid in
north
Natural resources
small offshore oil deposits, limestone,
marble, timber
People and Society
Population
total: 14,697,052
Ethnic groups
Fon and related 38.4%, Adja and related
15.1%, Yoruba and related 12%, Bariba and
related 9.6%, Fulani and related 8.6%,
Ottamari and related 6.1%, Yoa-Lokpa and
related 4.3%, Dendi and related 2.9%, other
0.9%, foreigner 1.9% (2013 est.)
Languages
55 languages; French (official); Fon (a Gbe
language), Yom (a Gur language) and
Yoruba are the most important indigenous languages in the south; half a dozen
regionally important languages in the north, including Bariba and Fulfulde
Religions
Muslim 27.7%, Roman Catholic 25.5%,
Protestant 13.5% (Celestial 6.7%, Methodist
3.4%, other Protestant 3.4%), Vodoun
11.6%, other Christian 9.5%, other traditional religions 2.6%, other 2.6%, none 5.8% (2013 est.)
Population growth rate
3.29% (2024 est.)
Government type
presidential republic
Capital name: Porto-Novo (constitutional capital); Cotonou (seat of government)
head of government: President Patrice TALON
Economy
Real GDP (purchasing power parity)
$52.51 billion (2023 est.)
$49.374 billion (2022 est.)
$46.468 billion (2021 est.)
Real GDP per capita
$3,700 (2023 est.)
$3,600 (2022 est.)
$3,500 (2021 est.
Exports
$4.271 billion (2022 est.)
$4.154 billion (2021 est.)
$3.506 billion (2020 est.)
Exports – partners
UAE 42%, Bangladesh 20%, India 11%,
China 5%, Togo 3% (2023)
Exports – commodities
gold, cotton, coconuts/brazil nuts/cashews,
soybeans, wood (2023)
Imports
$5.296 billion (2022 est.)
$4.925 billion (2021 est.)
$3.942 billion (2020 est.)
Imports – partners
China 21%, India 15%, USA 6%, France 6%,
Nigeria 4% (2023)
Imports – commodities
rice, refined petroleum, palm oil, poultry, cars (2023)
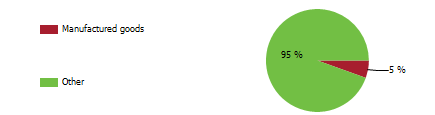
Export structure by product group in 2023(UNCTAD)
The export structure of a nation encompasses the variety, composition, and value of the goods and services it offers to international markets, serving as a critical indicator of the nation’s economic health, competitiveness, and level of development. In the case of Benin, the export structure underscores a significant reliance on the agricultural sector, with a noticeable lack of diversification across other industries. This dependence on agriculture not only highlights the challenges faced in achieving economic stability but also restricts potential avenues for growth, making it crucial for the nation to explore strategies aimed at broadening its economic base to ensure sustainable development.
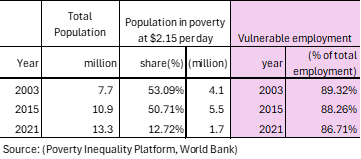
Poverty and vulnerable employment (PIP, World Bank)
Understanding Poverty level significance at $2.15 per day
In 2021, 13 percent of the population in Benin (about 2 million people) lived in poverty at $2.15 per day. The poverty level at $2.15 per day (measured in 2017 purchasing power parity, or PPP) is a key global benchmark used by the World Bank to define extreme poverty in low-income countries. It indicates:
1. Basic Survival Threshold
• People living below $2.15 per day struggle to afford essential needs such as food, clean water, shelter, healthcare, and education.
2. Economic Underdevelopment
• A high percentage of a country’s population living below this threshold suggests low economic productivity, high unemployment, and weak social safety nets.
3. Inequality and Social Vulnerability
• It reflects deep income inequality and a lack of access to opportunities for upward mobility.
• People in this category are more vulnerable to shocks like food price increases, climate disasters, or health crises.
4. Policy Challenges
• Governments need targeted interventions such as social welfare programs, job creation, and improved access to education and healthcare to reduce poverty.
A country's export structure is a reflection of its level of development and its productive capacities
The export structure of a country refers to the composition, diversity, and value of the goods and services it sells to other countries. It provides key insights into the country’s economic health, competitiveness, and level of development. Productive capacities of a country refer to its ability to produce goods and services efficiently and sustainably over time. These capacities are shaped by various factors, including human capital, natural resources, infrastructure, private sector, development, technology & innovation, institutions & governance, financial systems trade & market access.
Here’s what the export structure and productive capacities of a country typically indicate:
- Level of Economic Development
- Developed economies usually export high-value manufactured goods, technology, and services.
- Developing economies often rely on raw materials, agricultural products, or low-value manufactured goods.
- Industrial and Sectoral Strengths
- A strong presence of high-tech or industrial goods (e.g., machinery, electronics) suggests a well-developed manufacturing sector.
- A dominance of commodities (e.g., oil, minerals, agricultural products) indicates reliance on natural resources.
- Export Diversification
- A diverse export base (multiple industries) makes a country’s economy more stable and resilient to global price shocks.
- A concentrated export base (few key products) makes it vulnerable to market fluctuations.
- Trade Partnerships and Dependence
- If exports are heavily dependent on a single country or region, the economy is more exposed to geopolitical and trade risks.
- A wide range of trading partners indicates stronger global integration.
- Competitiveness and Value Addition
- Exporting mainly raw materials (e.g., crude oil instead of refined petroleum) suggests limited industrial processing capacity.
- A high share of finished and high-tech goods suggests strong value addition and competitiveness.
Benin-Sanitation
Benin – Proportion of population served with at least basic sanitation
In 2022, proportion of population served with at least basic sanitation for Benin was 19.5 %. Proportion of population served with at least basic sanitation of Benin increased from 8.6% in 2000 to 19.5 % in 2022 an absolute change of 10.9pp between 2000 and 2022.
Benin – Proportion of urban population served with at least basic sanitation facilities
In 2022, proportion of urban population served with at least basic sanitation for Benin was 29.5 %. Proportion of urban population served with at least basic sanitation of Benin increased from 18.9 % in 2000 to 29.5 % in 2022, an absolute change of 10.6pp between 2000 and 2022.
Benin – Proportion of rural population served with at least basic sanitation facilities
In 2022, proportion of rural population served with at least basic sanitation for Benin was 9.6 %. Proportion of rural population served with at least basic sanitation of Benin increased from 2.2 % in 2000 to 9.6 % in 2022, an absolute change of 7.4pp between 2000 and 2022.
Benin- Population with access to basic Sanitation(% of the total population): A Global Perspective
Benin faces a critical challenge due to inadequate sanitation, leading to countless preventable deaths each year and a significant decline in the quality of life for its citizens. Access to sanitation is a fundamental human right that must be guaranteed for all individuals. In 2022, about 80 percent of the population, roughly 11 million people, lacked at least basic sanitation facilities, revealing severe deficiencies in the public health system and the urgent need for reforms. In contrast, countries like China, Indonesia, Sri Lanka, Thailand, and Vietnam report access rates from 88.2 to 99 percent, highlighting the global disparities that persist. Safe sanitation is vital for health, dignity, and well-being, underscoring the urgent need for collaborative initiatives that promote sustainable governance and inclusive strategies for safe sanitation across Sub-Saharan Africa.

Benin- Rural population with access to basic Sanitation(% of rural population): A Global Perspective
In the rural areas of Benin, countless individuals struggle with inadequate access to basic sanitation, a crisis that significantly impacts their daily lives and perpetuates poverty and health issues. This reality highlights that safe sanitation is a fundamental human right for all, regardless of location. Recent data shows that nearly 90 percent of the rural population, about 6 million people, lack basic sanitation, starkly contrasting with countries like Sri Lanka, Thailand, and Vietnam. These alarming statistics call for collective action to improve sanitation infrastructure, prioritizing health and dignity while considering the wider effects on community well-being. Our commitment to addressing these disparities is vital for fostering sustainable development and ensuring that every community receives the sanitation services it deserves. By collaborating with local stakeholders, we can envision a future where safe sanitation is a reality for all, enhancing the quality of life for the rural population in Benin.

Benin- Water Supply
Benin – Proportion of population served with at least basic drinking water
In 2022, proportion of population served with at least basic water for Benin was 67.4 %. Proportion of population served with at least basic water of Benin increased from 61.7% in 2000 to 67.4 % in 2022 ,an absolute change of 5.7perchantage points (pp) between 2000 and 2022.
Benin- Proportion of urban population served with at least basic water
In 2022, proportion of urban population served with at least basic water for Benin was 74.1 %. Proportion of urban population served with at least basic water of Benin fell gradually from 77.1% in 2000 to 74.1 % in 2022, an absolute change of 3pp between 2000 and 2022.
Benin – Proportion of rural population served with at least basic water
In 2022, proportion of rural population served with at least basic water for Benin was 60.8 %. Proportion of rural population served with at least basic water of Benin increased from 52.2% in 2000 to 60.8 % in 2022, an absolute change of 8.6pp between 2000 and 2025.
Benin-Population with access to basic drinking water (% of the total population): A Global Perspective
As of 2022, around 4 million people, or 33 percent of Benin’s population, lacked access to basic drinking water services, contrasting sharply with the universal access seen in countries like South Korea and Thailand. This gap underscores the daily challenges faced by communities, affecting health, education, and overall quality of life. Recognizing these inequalities is crucial as we strive for sustainable solutions and essential infrastructure that ensures everyone can access this vital resource. These concerning statistics highlight the urgent need for collaborative action to promote sustainable governance and implement inclusive strategies that secure access to safe drinking water for all in Sub-Saharan Africa.

Benin- Rural population with access to basic drinking water (% of rural population): A Global Perspective
As of 2022, around 3 million people, or 39 percent of the rural population in Benin, lacked access to basic drinking water. In contrast, rural areas in countries like Vietnam, Taiwan, and China enjoy 100 percent access, emphasizing that safe drinking water is a fundamental human right. This significant disparity in water services highlights the urgent need for action across Sub-Saharan Africa and resonates with the daily struggles of those without this essential resource. The inequalities in water access profoundly affect health, education, and overall well-being, making it crucial for us to unite and address these challenges. Through collaboration and compassion, we can strive for a future where everyone in Sub-Saharan Africa can experience health and equity.

Benin-Access to Electricity
Benin-Access to electricity (% of population)
In 2022, proportion of population with access to electricity for Benin was 56.5%. The proportion of population with access to electricity of Benin increased from 21.5% in 2000 to 56.5% in 2022, 35.0pp increase between 2000 and 2022.
Benin-Access to Electricity (% urban population)
In 2022, proportion of urban population with access to electricity for Benin was 71.1%. The proportion of urban population with access to electricity of Benin increased from 47.5% % in 2000 to 71.1% in 2022, 23.6 pp increase between 2000 and 2022.
Benin-Access to electricity (% rural population)
In 2022, proportion of rural population with access to electricity for Benin was 45.5%. The proportion of rural population of Benin with access to electricity of increased from 5.4 %in 2000 to 45.5% in 2022, 40.1pp increase between 2000 and 2022.
Benin – Proportion of population with access to electricity: A Global Perspective
In 2022, about 43 percent of Benin’s population, nearly 6 million people, struggled with unreliable electricity, underscoring the urgent challenges the country faces as it falls behind nations like Thailand, South Korea, Sri Lanka, and Indonesia, which have achieved universal electricity access. Electricity is not merely a convenience; it is essential in the fight against poverty and crucial for economic growth and development. While global progress is evident, with the percentage of those lacking electricity declining from 20 percent in 2000 to under 10 percent today, many Sub-Saharan African countries, including Benin, continue to confront significant barriers that impede the goal of universal electricity access.

Benin – Proportion of rural population with access to electricity: A Global Perspective
Access to electricity is essential; it is a vital lifeline that can transform lives, lift communities out of poverty, and drive sustainable economic growth. Understanding electricity access among populations is crucial to assessing social and economic progress. While global electricity access has significantly increased in recent decades, particularly in low and middle-income countries, the journey toward universal access is ongoing. In Sub-Saharan Africa, the lack of reliable electricity remains a serious challenge for many. For instance, in 2022, 54 percent of the rural population in Benin, about 4 million people, were still without electricity at home. In contrast, countries like Vietnam, Thailand, South Korea, Malaysia, and China have achieved full electricity access in rural regions. This disparity underscores the urgent need for transformative governance in Sub-Saharan Africa to ensure everyone can enjoy the substantial benefits that electricity brings to daily life.

Benin- Health Outcomes
Benin-Life expectancy: A Global Perspective
When examining life expectancy trends over the past seventy years, it is clear that while many countries have achieved significant gains in longevity, Sub-Saharan Africa has faced considerable challenges. In 1950, the global average life expectancy for newborns was 47 years, rising to 71 years by 2021. In Benin, life expectancy increased from 38 years in 1960 to 60 years in 2022, highlighting ongoing healthcare and quality of life issues. In contrast, South Korea saw life expectancy rise dramatically from 21 years in 1950 to 84 years in 2021, while the Maldives improved from 39 years in 1960 to 81 years in 2022, demonstrating stark global disparities in health outcomes and the urgent need to address existing inequities.

Benin-Mortality rate, under-5 (per 1,000 live births): A Global Perspective
Since 1950, global child mortality rates have significantly declined due to better living conditions, improved healthcare access, enhanced nutrition, and safe drinking water. In wealthy nations like those in Europe and America, rates have fallen below 4 percent, highlighting successful public health efforts. While many developing countries in South America, Asia, and Africa have made progress, Sub-Saharan Africa has seen slower advancements. For example, Benin reduced its child mortality rate from 172per 1000 live births in 1980 to 80.8 in 2022, and Bangladesh from 206 to just 29 in the same period, demonstrating the effectiveness of targeted health initiatives. Overall, the global child mortality rate dropped from 22.7 percent in 1950 to 3.6 percent in 2023, underscoring the ongoing need for efforts to improve health outcomes for children in Sub-Saharan Africa.

Benin- Maternal mortality ratio ( per 100,00 live births): A Global Perspective
In this statistical analysis, we explore the annual occurrences of pregnancy-related fatalities, categorized by region and country, highlighting an urgent public health crisis that affects many lives. The data shows that a significant number of these tragic deaths occur in Sub-Saharan Africa, where high birth rates coincide with alarming maternal mortality rates. For instance, in Benin, maternal deaths increased from 469 in 2000 to 523 in 2020, emphasizing the critical need for improved healthcare interventions and support systems for mothers and infants. In contrast, countries like Bangladesh and Indonesia have made impressive progress in lowering maternal mortality, with Bangladesh reducing deaths from 441 in 2000 to 123 in 2020, India decreasing fatalities from 384 to 103, and Indonesia lowering its count from 299 to 173. These examples demonstrate the potential for significant change when effective healthcare strategies are implemented, inspiring hope in families and communities seeking better health outcomes.
