
Ghana
Country Flag Details: three equal horizontal bands of red (top), yellow, and green, with a large black five-pointed star centered in the yellow band; red symbolizes the blood shed for independence, yellow represents the country’s mineral wealth, while green stands for its forests and natural wealth; the black star is said to be the lodestar of African freedom
note: uses the popular Pan-African colors of Ethiopia; similar to the flag of Bolivia, which has a coat of arms centered in the yellow band
Background Ghana in 1957 became the first Sub-Saharan country in colonial Africa to gain its independence. Ghana has a young age
structure, with approximately 57% of the
population under the age of 25.
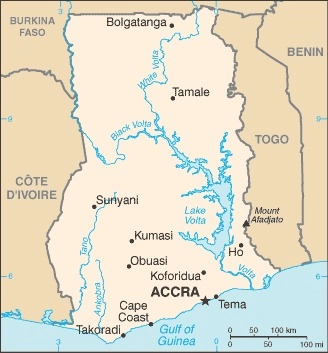
Geography
Area
total: 238,533 sq km
land: 227,533 sq km
water: 11,000 sq km
Climate
tropical; warm and comparatively dry along
southeast coast; hot and humid in
southwest; hot and dry in north.
Natural resources
gold, timber, industrial diamonds, bauxite,
manganese, fish, rubber, hydropower,
petroleum, silver, salt, limestone
People and Society
Population
total: 34,589,092
Ethnic groups
Akan 45.7%, Mole-Dagbani 18.5%, Ewe
12.8%, Ga-Dangme 7.1%, Gurma 6.4%,
Guan 3.2%, Grusi 2.7%, Mande 2%, other
1.6% (2021 est.)
Languages
Asante 16%, Ewe 14%, Fante 11.6%, Boron
(Brong) 4.9%, Dagomba 4.4%, Dangme
4.2%, Dagarte (Dagaba) 3.9%, Kokomba
3.5%, Akyem 3.2%, Ga 3.1%, other 31.2%
(2010 est.) Religions
Christian 71.3% (Pentecostal/Charismatic
31.6%, Protestant 17.4%, Catholic 10%,
other 12.3%), Muslim 19.9%, traditionalist
3.2%, other 4.5%, none 1.1% (2021 est.)
Population growth rate
2.15% (2024 est.)
Government type
presidential republic
Capital name: Accra
Executive branch
chief of state: President John Dramani MAHAMA (since 7 January 2025)
head of government: President Nana Addo Dankwa AKUFO-ADDO (since 7 January 2017)
Economy
Real GDP (purchasing power parity)
$229.639 billion (2023 est.)
$223.07 billion (2022 est.)
$214.867 billion (2021 est.)
Real GDP per capita $6,800 (2023 est.)
$6,700 (2022 est.)
$6,600 (2021 est.)
Exports
$25.365 billion (2023 est.)
$25.52 billion (2022 est.)
$23.901 billion (2021 est.)
Exports – partners
Switzerland 24%, UAE 18%, India 8%, South Africa 7%, China 7% (2023)
Exports – commodities
gold, crude petroleum, cocoa beans,
manganese ore, cocoa paste (2023)
Imports
$26.024 billion (2023 est.)
$26.329 billion (2022 est.)
$25.967 billion (2021 est.)
Imports – partners
China 30%, Netherlands 8%, India 5%, USA 5%, Russia 5% (2023)
Imports – commodities
refined petroleum, cars, plastics, plastic
products, footwear (2023)
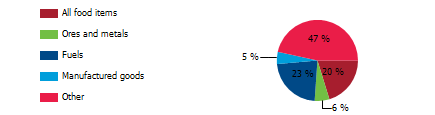
Export structure in product groups in 2023 (% of total export)(UNCTAD)
The export structure of a country encompasses the variety, composition, and value of its goods and services traded internationally, offering crucial insights into the nation’s economic vitality, competitiveness, and stage of development. Ghana’s export structure is diverse, with key sectors including precious metals, energy resources, agricultural products, and minerals. This export composition underscores Ghana’s reliance on natural resources and agricultural commodities. Efforts to diversify the economy include initiatives like the proposed “Petroleum Hub,” aiming to establish Ghana as a leading petroleum refiner in West Africa
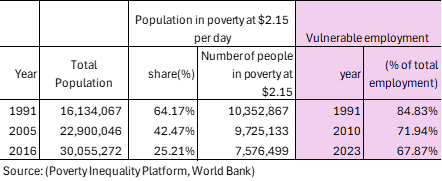
Poverty and vulnerable employment in Ghana (World Bank)
Understanding poverty level significance at $2.15 per day
In 2016, 25 percent of Ghana’s population lived in poverty at $2.15 per day. The poverty level at $2.15 per day (measured in 2017 purchasing power parity, or PPP) is a key global benchmark used by the World Bank to define extreme poverty in low-income countries. It indicates:
1. Basic Survival Threshold
• People living below $2.15 per day struggle to afford essential needs such as food, clean water, shelter, healthcare, and education.
2. Economic Underdevelopment
• A high percentage of a country’s population living below this threshold suggests low economic productivity, high unemployment, and weak social safety nets.
3. Inequality and Social Vulnerability
• It reflects deep income inequality and a lack of access to opportunities for upward mobility.
• People in this category are more vulnerable to shocks like food price increases, climate disasters, or health crises.
4. Policy Challenges
• Governments need targeted interventions such as social welfare programs, job creation, and improved access to education and healthcare to reduce poverty.
A country's export structure is a reflection of its level of development and its productive capacities
The export structure of a country refers to the composition, diversity, and value of the goods and services it sells to other countries. It provides key insights into the country’s economic health, competitiveness, and level of development. Productive capacities of a country refer to its ability to produce goods and services efficiently and sustainably over time. These capacities are shaped by various factors, including human capital, natural resources, infrastructure, private sector, development, technology & innovation, institutions & governance, financial systems trade & market access.
Here’s what the export structure and productive capacities of a country typically indicate:
- Level of Economic Development
- Developed economies usually export high-value manufactured goods, technology, and services.
- Developing economies often rely on raw materials, agricultural products, or low-value manufactured goods.
- Industrial and Sectoral Strengths
- A strong presence of high-tech or industrial goods (e.g., machinery, electronics) suggests a well-developed manufacturing sector.
- A dominance of commodities (e.g., oil, minerals, agricultural products) indicates reliance on natural resources.
- Export Diversification
- A diverse export base (multiple industries) makes a country’s economy more stable and resilient to global price shocks.
- A concentrated export base (few key products) makes it vulnerable to market fluctuations.
- Trade Partnerships and Dependence
- If exports are heavily dependent on a single country or region, the economy is more exposed to geopolitical and trade risks.
- A wide range of trading partners indicates stronger global integration.
- Competitiveness and Value Addition
- Exporting mainly raw materials (e.g., crude oil instead of refined petroleum) suggests limited industrial processing capacity.
- A high share of finished and high-tech goods suggests strong value addition and competitiveness.
Ghana-Sanitation
Ghana – Proportion of population served with at least basic sanitation
In 2022, proportion of population served with at least basic sanitation for Ghana was 28.6 %. Proportion of population served with at least basic sanitation of Ghana increased from 6.2 % in 2000 to 28.6 % in 2022, an absolute change of 22.4 percentage points (pp) between 2000 and 2025.
Ghana – Proportion of urban population served with at least basic sanitation
In 2022, proportion of urban population served with at least basic sanitation for Ghana was 33.7 %. Proportion of urban population served with at least basic sanitation of Ghana increased from 11.5 % in 2000 to 33.7 % in 2022, an absolute change of 22.2pp between 2000 and 2025.
Ghana – Proportion of rural population served with at least basic sanitation
In 2022, proportion of rural population served with at least basic sanitation for Ghana was 21.4 %. Between 2003 and 2022, proportion of rural population served with at least basic sanitation of Ghana grew substantially from 2.2% in 2000 to 21.4 % in 2022, an absolute change of 19.2pp between 2000 and 2025.
Ghana – Proportion of population served with at least basic sanitation: A Global Perspective
Access to safe sanitation is not merely a fundamental human need, it is an inherent human right that preserves individual dignity and fosters overall well-being in society. Regrettably, the stark reality in Ghana reveals that in 2022, only 28.6 percent of the population in Ghana had access to basic sanitation. In sharp contrast, nations such as Thailand and South Korea enjoyed nearly 100 percent access to basic sanitation facilities, highlighting the critical need for Ghana to urgently address and remedy this serious challenge swiftly and effectively to ensure a healthier environment for all its citizens.

Ghana – Proportion of rural population served with at least basic sanitation: A Global Perspective
Ghana’s rural population continues to grapple with profound obstacles in securing basic sanitation facilities, as evidenced by the fact that only 21 percent had access to adequate services in 2022. This stark figure stands in sharp contrast to countries such as Vietnam, Sri Lanka, and Thailand, where access rates soar to 88 percent, 95 percent, and 98 percent respectively. Such statistics highlight not only the pressing need for improved sanitation in Ghana but also the significant disparities in living standards that persist across rural areas in many Sub-Saharan African nations. Addressing these challenges is crucial for enhancing public health and overall quality of life in these underserved communities.

Ghana-Water Supply
Ghana – Proportion of total population served with at least basic water
In 2022, proportion of population served with at least basic water for Ghana was 88.4 %. Proportion of population served with at least basic water of Ghana increased from 65.2 % in 2000 to 88.4 % in 2022 , an absolute change of 23.2 pp, between 2000 and 2022.
Ghana – Proportion of urban population served with at least basic water
In 2022, proportion of urban population served with at least basic water for Ghana was 98.4 %. Proportion of urban population served with at least basic water of Ghana increased from 79.6 % in 2003 to 98.4 % in 2022 an absolute change of 18.8 pp between 2000 and 2022.
Ghana – Proportion of rural population with at least basic water
In 2022, proportion of rural population served with at least basic water for Ghana was 74.1 %. Proportion of rural population served with at least basic water of Ghana increased from 53.9 % in 2000 to 74.1 % in 2022 , an absolute change of 20.2 pp between 2000 and 2022.
Ghana – Proportion of total population not served with at least basic water: A Global Perspective
Access to safe drinking water is not just a basic human necessity but also a fundamental human right that underpins the dignity and welfare of individuals and communities worldwide. It is alarming that in 2022, nearly 4 million people in Ghana were deprived of safe drinking water, representing approximately 12% of the population. This situation starkly contrasts with countries such as Thailand, where nearly universal access has been achieved, ensuring that 100% of the population benefits from safe drinking water, while Vietnam is not far behind with an impressive 98%. Such a troubling disparity underscores the immediate and critical need for effective measures aimed at enhancing living conditions across Sub-Saharan Africa, reinforcing the essential need for all people to enjoy the basic right to safe drinking water.

Ghana – Proportion of rural population not served with at least basic water: A Global Perspective
In 2022, nearly 4 million individuals, representing about 26% of Ghana’s rural population, faced the troubling reality of lacking access to essential drinking water facilities, illuminating a significant public health crisis that profoundly affects families and communities alike. In stark contrast, countries such as Thailand, Bangladesh, Vietnam, and China have made remarkable strides, achieving nearly universal access to safe drinking water for their rural populations, with access rates soaring to 100%, 98%, 97%, and 96% respectively. This glaring disparity not only highlights an urgent call to action but also emphasizes the critical need for compassionate and comprehensive initiatives designed to enhance living conditions and secure access to the essential resource of safe drinking water for all individuals in rural areas across Sub-Saharan Africa.

Ghana-Access to Electricity
Ghana-Access to electricity (% of population)
In 2022, proportion of population with access to electricity for Ghana was 85.1 %. The proportion of population with access to electricity of Ghana increased from 43.7% in 2000 to 85.1 % in 2022, an absolute change of 41.4 pp between 2000 and 2022.
Ghana-Access to electricity (% urban population)
In 2022, proportion of urban population with access to electricity for Ghana was 95 %. The proportion of urban population with access to electricity of Ghana increased from 80.5% in 2000 to 95% in 2022, an absolute change of 14.5 pp between 2000 and 2022.
Ghana-Access to electricity (% rural population)
In 2022, proportion of rural population with access to electricity for 71.6%. The proportion of rural population with access to electricity of Ghana increased from 14.9% in 2000 to 71.6% in 2022, an absolute change of 16.2 pp between 2000 and 2022.
Ghana-Access to electricity (% of population): A Global Perspective
In 2022, Ghana’s electricity access rate was recorded at 85.1 percent, meaning that approximately 15 percent of the population, which translates to around 5 million individuals, still live without electricity. This situation starkly contrasts with countries such as Vietnam, Thailand, Sri Lanka, and Malaysia, all of which have achieved a complete electrification rate of 100 percent. This notable disparity underscores the pressing need for a concerted and comprehensive effort to enhance the living standards for all citizens in Ghana, as reliable electricity is fundamental for development, economic growth, and improved quality of life.

Ghana-Access to electricity (% rural population): A Global Perspective
The chart below illustrates a troubling disparity in electricity access between rural Ghana and rural areas in other developing nations, highlighting an urgent need for substantial advancements. In 2022, only 71.6% of Ghana’s rural population had access to electricity, while their counterparts in South Korea, Malaysia, Sri Lanka, Thailand, and Vietnam enjoyed complete access at an impressive 100%. This stark contrast reveals the need for immediate action to enhance the living standards of all Ghanaian citizens and guarantee equitable access to essential services vital for development and well-being.

Ghana: Health outcomes
Ghana- Life expectancy: A Global Perspective
The past seven decades have witnessed a remarkable shift in global life expectancy, reflecting significant advancements in health and longevity; in 1950, the average life expectancy for newborns across the globe stood at a mere 47 years, yet by 2021, it had climbed to an impressive 71 years. However, this progress has not been evenly distributed, particularly in numerous Sub-Saharan African countries where improvements have been limited. For example, in Ghana, life expectancy has seen a gradual rise from 47 years in 1960 to only 64 years in 2022, representing a modest increase compared to the extraordinary gains experienced in other nations. South Korea serves as a striking example of this disparity, with life expectancy soaring from just 21 years in 1950 to an astonishing 83 years in 2021, while the Maldives experienced a substantial rise from 39 years in 1960 to 81 years in 2022. These stark contrasts highlight the ongoing challenges and inequalities that persist globally, emphasizing the critical need for a sustained dedication to achieving health equity and improving overall well-being for all populations, especially in regions that have yet to reap the benefits of such advancements.

Ghana-Under -5 mortality rate (per 1000 live births): A Global Perspective
Since 1950, there has been a remarkable decline in global child mortality rates, largely attributed to enhancements in living conditions, advancements in healthcare, improved nutrition, and greater access to safe drinking water. In the wealthiest regions of Europe and America, child mortality rates have plummeted to below 4 percent, reflecting the benefits of these improvements. Over the past seven decades, many developing nations in South America, Asia, and Africa have also experienced significant advancements in reducing child mortality. However, the pace of progress remains sluggish in numerous Sub-Saharan African countries. For instance, Ghana’s under-5 mortality rate showed a substantial decrease from 167 in 1980 to 42 in 2022. In comparison, Bangladesh witnessed an impressive decline from 206 in 1980 to just 29 in 2022, while India experienced a drop from 169 in 1960 to 29 in 2022. These figures highlight the pressing need for immediate and concerted action to ensure a brighter future for children throughout Sub-Saharan Africa, where the challenges persist and further efforts are essential.

Ghana-Maternal mortality ratio (per 100,000 live births): A Global Perspective
The chart below reveals the sobering reality of annual pregnancy-related deaths across various regions and countries, highlighting the devastating toll that these losses inflict, especially in Sub-Saharan Africa, where the majority of these unfortunate incidents are concentrated. This alarming trend can be attributed not only to the region’s consistently elevated birth rates but also to its significantly high maternal mortality rates, which pose a grave challenge to public health. However, there is reason for optimism as Ghana has successfully reduced its maternal deaths from 499 in 2000 to 263 in 2022, showcasing a strong commitment to enhancing maternal health services and outcomes. Likewise, Bangladesh has made commendable strides, lowering maternal fatalities from 441 in 2000 to 123 in 2022, while India has also experienced notable improvement, with deaths decreasing from 384 in 2000 to 103 in 2022. These reductions in maternal mortality rates reflect successful health initiatives and policies; nevertheless, the ongoing struggle to protect and promote maternal health remains a critical and urgent priority for many developing nations.
