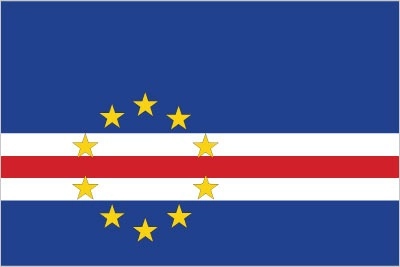
Cabo Verde
Country Flag Details: five unequal horizontal bands; the top-most band of blue – equal to one -half the width of the flag – is followed by three bands of white, red, and white, each equal to 1/12 of the width, and a bottom stripe of blue equal to one quarter of the flag width; a circle of 10 yellow, five-pointed stars is centered on the red stripe and positioned 3/8 of the length of the flag from the hoist side; blue stands for the sea and the sky, the circle of stars represents the 10 major islands united into a nation, the stripes symbolize the road to formation of the country through peace (white) and effort (red)
Background The Portuguese discovered and colonized
the uninhabited Cabo Verde islands in the
15th century. After independence in 1975, a
one-party system was established and
maintained until multi-party elections were
held in 1990. Cabo Verde continues to
sustain one of Africa’s most stable
democratic governments and relatively
stable economies.
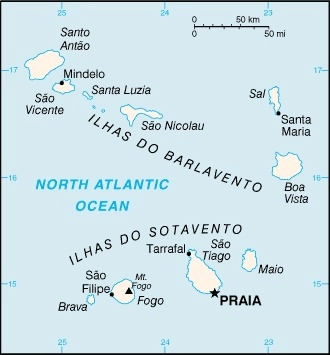
Geography
Area
total : 4,033 sq km
land: 4,033 sq km
water: 0 sq km
Climate
temperate; warm, dry summer; precipitation meager and erratic
Natural resources
salt, basalt rock, limestone, kaolin, fish, clay, gypsum
People and Society
Population
total: 611,014
Ethnic groups
Creole (Mulatto) 71%, African 28%,
European 1%
Languages
Portuguese (official), Crioulo (a Portuguese- based creole language with two main
dialects)
Religions Roman Catholic 72.5%, Protestant 4%
(includes Adventist 1.9%, Nazarene 1.8%,
Assembly of God 0.2%, God is Love 0.1%),
Christian Rationalism 1.7%, Muslim 1.3%,
Jehovah’s Witness 1.2%, Church of Jesus
Christ 1%, other Christian 1.3%, other 1.2%,
none 15.6%, no response 0.4% (2021 est.)
Population growth rate
1.16% (2024 est.)
Government type
parliamentary republic
Capital name: Praia
Executive branch
chief of state: President Jose Maria Pereira NEVES (since 9 November 2021)
head of government: Prime Minister Jose Ulisses CORREIA e SILVA (since 22 April 2016)
Economy
Real GDP (purchasing power parity)
$4.852 billion (2023 est.)
$4.6 billion (2022 est.)
$3.971 billion (2021 est.)
Real GDP per capita
$9,300 (2023 est.)
$8,900 (2022 est.)
$7,700 (2021 est.
Exports
$971.679 million (2023 est.)
$851.907 million (2022 est.)
$465.348 million (2021 est.)
Exports – partners
Spain 46%, Portugal 9%, Togo 7%, Italy 7%,
India 6% (2023)
Exports – commodities
fish, refined petroleum, railway cargo
containers, shellfish, garments (2023)
Imports
$1.428 billion (2023 est.)
$1.31 billion (2022 est.)
$1.117 billion (2021 est.)
Imports – partners
Portugal 29%, Saudi Arabia 11%,
Netherlands 9%, Spain 8%, China 7%
(2023)
Imports – commodities
refined petroleum, aircraft, cars, fish, railway cargo containers (2023)
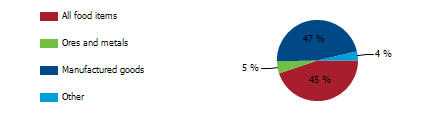
Export structure by product group in 2023 (% of total export)(UNCTAD)
The export structure of a country signifies the diverse range, composition, and economic significance of its goods and services traded internationally, acting as an essential barometer of its economic well-being, competitive standing, and stage of development. In the case of Cabo Verde, this structure not only underscores the nation’s economic strengths but also identifies key areas of specialization that contribute to its growth. The exports of Cabo Verde are predominantly concentrated in a few pivotal sectors, namely fisheries and related seafood products, which consist of a significant portion of Cabo Verde’s exports, agriculture, mineral and fuels, and services.
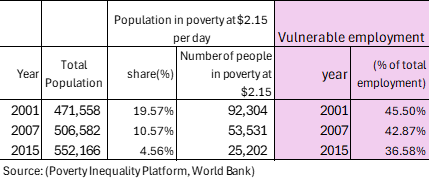
Poverty and vulnerable employment (World Bank)
Understanding the poverty level at $2.15 per day
In 2015, 5 percent of Cabo Verde’s population lived in poverty at $2.15 per day. The poverty level at $2.15 per day (measured in 2017 purchasing power parity, or PPP) is a key global benchmark used by the World Bank to define extreme poverty in low-income countries. It indicates:
Basic Survival Threshold People living below $2.15 per day struggle to afford essential needs such as food, clean water, shelter, healthcare, and education.
Economic Underdevelopment A high percentage of a country’s population living below this threshold suggests low economic productivity, high unemployment, and weak social safety nets.
Inequality and Social Vulnerability
It reflects deep income inequality and a lack of access to opportunities for upward mobility. People in this category are more vulnerable to shocks like food price increases, climate disasters, or health crises.
Policy Challenges Governments need targeted interventions such as social welfare programs, job creation, and improved access to education and healthcare to reduce poverty.
A country's export structure is a reflection of its level of development and its productive capacities
The export structure of a country refers to the composition, diversity, and value of the goods and services it sells to other countries. It provides key insights into the country’s economic health, competitiveness, and level of development. Productive capacities of a country refer to its ability to produce goods and services efficiently and sustainably over time. These capacities are shaped by various factors, including human capital, natural resources, infrastructure, private sector, development, technology & innovation, institutions & governance, financial systems trade & market access.
Here’s what the export structure and productive capacities of a country typically indicate:
- Level of Economic Development
- Developed economies usually export high-value manufactured goods, technology, and services.
- Developing economies often rely on raw materials, agricultural products, or low-value manufactured goods.
- Industrial and Sectoral Strengths
- A strong presence of high-tech or industrial goods (e.g., machinery, electronics) suggests a well-developed manufacturing sector.
- A dominance of commodities (e.g., oil, minerals, agricultural products) indicates reliance on natural resources.
- Export Diversification
- A diverse export base (multiple industries) makes a country’s economy more stable and resilient to global price shocks.
- A concentrated export base (few key products) makes it vulnerable to market fluctuations.
- Trade Partnerships and Dependence
- If exports are heavily dependent on a single country or region, the economy is more exposed to geopolitical and trade risks.
- A wide range of trading partners indicates stronger global integration.
- Competitiveness and Value Addition
- Exporting mainly raw materials (e.g., crude oil instead of refined petroleum) suggests limited industrial processing capacity.
- A high share of finished and high-tech goods suggests strong value addition and competitiveness.
Cabo Verde-Sanitation
Cabo Verde- Proportion of population served with at least basic sanitation
In 2022, proportion of population served with at least basic sanitation for Cabo Verde was 83.0%. Proportion of population served with at least basic sanitation of Cabo Verde increased from 36.8 % in 2000 to 83.0 % in 2022, an absolute change of 45.2 percentage points (pp) between 2000 and 2022.
Cabo Verde- Proportion of urban population served with at least basic sanitation facilities
In 2022, proportion of urban population served with at least basic sanitation for Cabo Verde was 86.1%. Proportion of urban population served with at least basic sanitation of Cabo Verde increased from 52.6 % in 2000 to 86.1% in 2022, an absolute change of 33.5 pp between 2000 and 2022.
Cabo Verde – Proportion of rural population served with at least basic sanitation facilities
In 2022, proportion of rural population served with at least basic sanitation for Cabo Verde was 76.6%. Proportion of rural population served with at least basic sanitation of Cabo Verde increased from 18.8 % in 2000 to 76.6 % in 2022, an absolute change of 57.8 pp between 2000 and 2022.
Cabo Verde-Proportion of population served with at least basic sanitation: A Global Perspective
In 2022, 83.0 percent of the population in Cabo Verde had access to at least basic sanitation facilities, a significant increase from 36.8 percent in 2000, illustrating notable advancements in the country’s public health infrastructure while also revealing the necessity for ongoing enhancements. In comparison, countries like China, Indonesia, Sri Lanka, Thailand, and Vietnam achieved access rates between 88.2 percent and 99 percent, highlighting the impact of dedicated efforts and investments in this critical area. Access to safe sanitation is a fundamental human need that transcends mere statistics, serving as a cornerstone for health, dignity, and overall well-being, while also affecting education, economic productivity, and social stability. These statistics emphasize the urgent need for collaborative initiatives aimed at fostering sustainable governance and inclusive strategies to ensure safe sanitation for all individuals across Sub-Saharan Africa, paving the way for a healthier and more equitable future for generations to come.

Cabo Verde-Proportion of rural population served with at least basic sanitation: A Global Perspective
Access to safe sanitation is a fundamental human right that everyone deserves, regardless of their geographical location. In 2022, a remarkable 76.6 percent of the rural population in Cabo Verde had access to basic sanitation, reflecting a significant increase from just 18.8 percent in 2000. In comparison, countries like Sri Lanka achieved an impressive access rate of 94.9 percent, while Thailand and Vietnam reported 98.4 percent and 88.4 percent, respectively. These statistics underscore the urgent need for a concerted effort to advocate for improved sanitation infrastructure in rural areas across Sub-Saharan Africa, consistently prioritizing the health, dignity, and welfare of every individual. Our shared commitment to addressing these critical disparities is vital for fostering sustainable development and ensuring that every community can access the sanitation it rightfully deserves and needs to thrive. Together, we can aspire to a future where safe sanitation is not just a distant dream but a tangible reality for all, ultimately enhancing the quality of life for the rural population in Cabo Verde and contributing to a healthier environment for future generations.

Cabo Verde-Water Supply
Cabo Verde – Proportion of population served with at least basic drinking water services
In 2022, proportion of population served with at least basic water for Cabo Verde was 89.9 %. Proportion of population served with at least basic drinking water of Cabo Verde increased from 79.1% in 2000 to 89.9% in 2022, an absolute change of 10.8 pp between 2000 and 2022.
Cabo Verde- Proportion of urban population served with at least basic drinking water services
In 2022, proportion of urban population served with at least basic water for Cabo Verde was 93.2%. Proportion of urban population served with at least basic drinking water of Cabo Verde increased gradually from 87.5% in 2000 to 93.2% in 2022, an absolute change of 5.7 pp between 2000 and 2022.
Cabo Verde – Proportion of rural population served with at least basic drinking water services
In 2022, proportion of rural population served with at least basic water for Cabo Verde was 82.9 %. Proportion of rural population served with at least basic drinking water of Cabo Verde increased from 69.6% in 2000 to 82.9 % in 2022 an absolute change of 13.3 pp between 2000 and 2022.
Cabo Verde – Proportion of population served with at least basic drinking water: A Global Perspective
As of 2022, 89.9 percent of Cabo Verde’s population had access to at least basic drinking water services, a notable increase from 79.1 percent in 2000. In contrast, countries such as South Korea and Thailand have achieved the remarkable milestone of 100 percent access to safe drinking water, highlighting the essential nature of this resource for every individual worldwide. This disparity is not just a number; it illustrates the daily struggles faced by many communities across Sub-Saharan Africa, affecting their health, education, and overall quality of life. Acknowledging these inequalities is crucial in develop sustainable solutions and build the necessary infrastructure that guarantees reliable access to clean water for all, ultimately promoting better health and development outcomes. These alarming statistics stress the urgent call for collective action to foster sustainable governance and implement initiatives that ensure safe drinking water for everyone in Sub-Saharan Africa, ensuring that no community is overlooked in the quest for fundamental human rights.

Cabo Verde – Proportion of rural population served with at least basic drinking water: A Global Perspective
As of 2022, 82.9 percent of Cabo Verde’s rural population had access to at least basic drinking water, a notable improvement from 69.6 percent in 2000; however, 17 percent of the rural population in Cabo Verde still remained without access to this vital resource. In stark contrast, rural areas in countries Thailand achieved 100 percent complete access to safe drinking water in 2022, underscoring the fact that access to safe drinking water is a fundamental human right. The existing disparities in access to water services highlight an urgent necessity for enhanced infrastructure and the strategic allocation of essential resources to ensure that every individual, regardless of geographical location, can obtain necessary services. These significant gaps in water availability present severe challenges for countless communities across Sub-Saharan Africa, adversely affecting their health, educational opportunities, and overall quality of life. We must unite to address these critical issues, striving collectively toward a future that fosters health and equity for all individuals, regardless of their circumstances or geographical locations.

Cabo Verde-Access to Electricity
Cabo Verde-Access to electricity (% of population)
In 2022, proportion of population with access to electricity for Cabo Verde was 97.1%. The proportion of population with access to electricity of Cabo Verde increased from 58.6% in 2000 to 97.1% in 2022, an absolute change of 38.5pp between 2000 and 2022.
Cabo Verde- Access to Electricity (% urban population)
In 2022, proportion of urban population with access to electricity for Cabo Verde was 95.3%. The proportion of urban population with access to electricity of Cabo Verde increased from 81.9% % in 2000 to 95.3% in 2022, an absolute change of 13.4pp between 2000 and 2022.
Cabo Verde-Access to electricity (% rural population)
In 2022, proportion of rural population with access to electricity for Cabo Verde was 96.9%. The proportion of rural population of Cabo Verde with access to electricity increased from 31.8 % in 2000 to 96.9% in 2022, an absolute change of 65.1pp between 2000 and 2022.
Cabo Verde-Access to electricity (% of population): A Global Perspective
In 2022, an impressive 97.1 percent of Cabo Verde’s population had access to electricity, a notable rise from 58.6 percent in 2000. Despite this achievement, Cabo Verde still trails behind countries such as Thailand, Vietnam, and South Korea, which enjoy 100 percent electricity access. Access to electricity is not merely a convenience, but also a critical element in the battle against poverty and a significant engine for economic growth, enabling education, improving healthcare, and promoting entrepreneurship. Globally, access to electricity has improved considerably, dropping from 20 percent in 2000 to below 10 percent today, particularly in low and middle-income countries. However, many Sub-Saharan African nations continue to confront serious issues like inadequate infrastructure and financial constraints that impede their efforts to achieve universal electricity access, highlighting the urgent need for a unified regional initiative to address these challenges.

Cabo Verde-Access to electricity (% of rural population): A Global Perspective
As of 2022, an impressive 96.9 percent of the rural population in Cabo Verde had access to electricity, a remarkable increase from just 31.8 percent in 2000, positioning the country notably ahead of many of its neighbors in Sub-Saharan Africa. However, rural communities in nations like Vietnam, Thailand, South Korea, Malaysia, and China have already achieved universal electricity access. Access to electricity goes beyond mere convenience; it serves as an essential lifeline capable of transforming lives, lifting entire communities out of poverty, and promoting sustainable economic development. The ability to access reliable electricity can fundamentally change the socio-economic landscape of a region by enabling better education, healthcare, and opportunities for small businesses, highlighting transformative benefits that electricity can bring to an entire community.

Cabo Verde: Health outcomes
Cabo Verde- Life expectancy: A Global perspective
Cabo Verde has made significant strides in life expectancy over the past seventy years, a trend that mirrors broader global improvements; however, Sub-Saharan Africa as a whole has only seen limited progress in this crucial area. In 1950, the average life expectancy for newborns across the globe was 47 years, a figure that remarkably increased to 71 years by 2021, underscoring substantial advancements in health conditions worldwide. Cabo Verde’s own life expectancy has seen a commendable rise, moving from 49 years in 1960 to 74 years in 2022, reflecting the nation’s efforts to enhance public health and healthcare access. In stark contrast, countries such as South Korea have undergone extraordinary transformations, with life expectancy surging from just 21 years in 1950 to an impressive 83 years by 2022. The Maldives also showcases similar remarkable improvements, where life expectancy has jumped from 39 years in 1960 to 81 years in 2022. These stark disparities in health outcomes highlight the pressing need to confront health inequalities, pointing to the critical importance of promoting well-being throughout Sub-Saharan Africa to ensure that all citizens benefit from the progress seen in other parts of the world.

Cabo Verde: Mortality rates, under-5: A Global Perspective
Since 1950, there has been a significant global decline in child mortality rates, driven by factors such as improved living conditions, increased access to healthcare, better nutrition, and the availability of clean drinking water. In wealthier nations across Europe and America, child mortality rates have fallen dramatically, reflecting the success of public health initiatives and economic stability. Over the last seventy years, many developing countries in South America, Asia, and Africa have made meaningful progress in reducing child mortality, although advancements have been somewhat slower in several Sub-Saharan African nations. For example, Cabo Verde has successfully lowered its child mortality rate from 80 per 1,000 live births in 1980 to 12 per 1,000 live births in 2022, marking a significant achievement amid various challenges. Similarly, Bangladesh has seen an impressive reduction, with rates decreasing from 206 in 1980 to just 29 in 2022, highlighting the effectiveness of targeted health interventions and public health policies.

Cabo Verde: Maternal mortality ratio: A Global Perspective
Cabo Verde has made a significant progress in reducing maternal mortality, evidenced by a significant decline in deaths from 125 in 2000 to 42 in 2020, which statistics still underscore the critical need for not only improve healthcare services but also implement comprehensive support systems that address the multifaceted challenges faced by mothers across Sub-Saharan African region when compared to other developing regions. For instance, countries such as Bangladesh and Indonesia have achieved considerable advancements in maternal health, with Bangladesh reducing its maternal mortality rate dramatically from 441 in 2000 to 123 in 2020, and Indonesia from 299 to 173. These remarkable reductions not only showcase the effectiveness of targeted healthcare strategies tailored to enhance maternal health but also emphasize the immense potential for transformative change that can ultimately save lives, empower communities, and contribute to the establishment of healthier, more resilient communities.
