
Your Title Goes Here
Country Flag Details
two equal width horizontal bands of red (top) and blue separated by a central green band that splits into a horizontal Y, the arms of which end at the corners of the hoist side; the Y embraces a black isosceles triangle from which the arms are separated by narrow yellow bands; the red and blue bands are separated from the green band and its arms by narrow white stripes; the flag colors do not have any official symbolism, but the Y stands for the “convergence of diverse elements within South African society, taking the road ahead in unity”; black, yellow, and green are found on the flag of the African National Congress, while red, white, and blue are the colors in the flags of the Netherlands and the UK, whose settlers ruled South Africa during the colonial era
note: the South African flag is one of only two national flags to display six colors as part of its primary design, the other is South Sudan’s
Background
By about A.D. 500, Bantu-speaking groups settled into northeastern South Africa. Dutch traders landed at the southern tip of present-day South Africa in 1652. The British seized the Cape of Good Hope area in 1806. British and Afrikaners (Dutch descendants) ruled jointly from 1910 to 1961 in the Union of South Africa. The African National Congress (ANC) led the opposition to apartheid. The first multi-racial elections in 1994 followed the end of apartheid.
Geography
Area
total : 1,219,090 sq km
land: 1,214,470 sq km
water: 4,620 sq km
Climate
mostly semiarid; subtropical along east coast; sunny days, cool nights
Natural resources
gold, chromium, antimony, coal, iron ore, manganese, nickel, phosphates, tin, rare earth elements, uranium, gem diamonds, platinum, copper, vanadium, salt, natural gas
People and Society
Population
total: 60,442,647
Ethnic groups
Black African 80.9%, Colored 8.8%, White 7.8%, Indian/Asian 2.6% (2021 est.)
Languages
isiZulu or Zulu (official) 25.3%, isiXhosa or Xhosa (official) 14.8%, Afrikaans (official) 12.2%, Sepedi or Pedi (official) 10.1%, Setswana or Tswana (official) 9.1%, English (official) 8.1%, Sesotho or Sotho (official) 7.9%, Xitsonga or Tsonga (official) 3.6%, siSwati or Swati (official) 2.8%, Tshivenda or Venda (official) 2.5%, isiNdebele or Ndebele (official) 1.6%, other (includes South African sign language (official) and Khoi or Khoisan or Khoe languages) 2% (2018 est.)
Religions
Christian 86%, ancestral, tribal, animist, or other traditional African religions 5.4%, Muslim 1.9%, other 1.5%, nothing in particular 5.2% (2015 est.)
Population growth rate
1.07% (2024 est.)
Government
Government type
parliamentary republic
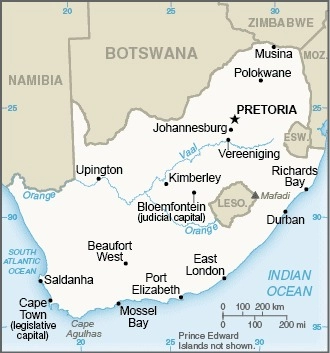
Capital name: Pretoria (administrative capital); Cape Town (legislative capital); Bloemfontein (judicial capital)
Executive branch
chief of state: President Matamela Cyril RAMAPHOSA (since 19 June 2024)
head of government: President Matamela Cyril RAMAPHOSA (since 19 June 2024)
Economy
Economic overview
upper middle-income South African economy; hard hit by COVID-19; poor utilities management; key rare earth goods exporter; high income inequality; hosts Africa’s largest stock exchange; rising unemployment, especially youth; land rights changes
Real GDP (purchasing power parity)
$865.402 billion (2023 est.)
$859.399 billion (2022 est.)
$843.28 billion (2021 est.)
Real GDP per capita
$13,700 (2023 est.)
$13,800 (2022 est.)
$13,700 (2021 est.)
Exports
$124.671 billion (2023 est.)
$136.01 billion (2022 est.)
$131.09 billion (2021 est.)
Exports – partners
China 19%, USA 8%, Germany 7%, India 7%, UK 6% (2023)
Exports – commodities
gold, platinum, coal, cars, iron ore (2023)
Imports
$123.454 billion (2023 est.)
$127.669 billion (2022 est.)
$104.881 billion (2021 est.)
Imports – partners
China 21%, India 7%, USA 7%, Germany 6%, UAE 4% (2023)
Imports – commodities
refined petroleum, crude petroleum, gold, cars, broadcasting equipment (2023)
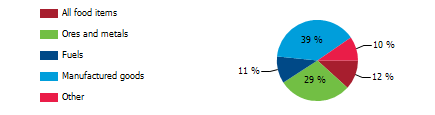
Export structure by product group (% of total exports) (UNCTAD)
The export structure of a nation reflects the variety, composition, and value of its goods and services engaged in international trade, offering vital insights into the country’s economic health, competitive position, and developmental status. In the case of South Africa, this export structure is notably intricate, characterized by significant contributions from sectors such as precious metals, ores, vehicles, and mineral fuels, which play a pivotal role in its economy. Although South Africa boasts a solid economic foundation, it is crucial for the nation to actively pursue ongoing diversification strategies while effectively tackling existing economic challenges to secure long-term, sustainable growth and enhance its standing in the global market.
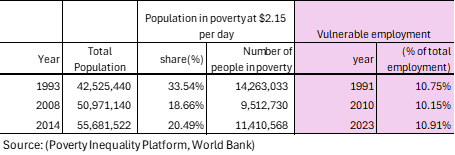
Poverty and vulnerable employment in South Africa (World Bank)
In 2023, 11 percent of total employment in South Africa was categorized as vulnerable employment, a term that encompasses jobs marked by insufficient job security, low wages, and a pronounced lack of social protections such as health insurance, pensions, and labor rights. This classification mainly includes own-account workers, who are self-employed individuals without employees, like street vendors and small-scale farmers, along with contributing family workers, who support family enterprises or farms without formal remuneration. These roles are often informal and precarious, lacking essential benefits, which significantly heightens the risk of economic instability, exploitation, and poverty for the workers involved. The ramifications of vulnerable employment reach far beyond individual experiences, negatively impacting families and entire communities, and fostering cycles of instability and hardship that can prove profoundly difficult to break, reinforcing the urgent need for comprehensive social support and policy reform to address these challenges.
Understanding poverty level significance at $2.15 per day
In 2014, 20 percent of the population in South Africa lived in poverty at $2.15 per day. The poverty level at $2.15 per day (measured in 2017 purchasing power parity, or PPP) is a key global benchmark used by the World Bank to define extreme poverty in low-income countries. It indicates:
1. Basic Survival Threshold
• People living below $2.15 per day struggle to afford essential needs such as food, clean water, shelter, healthcare, and education.
2. Economic Underdevelopment
• A high percentage of a country’s population living below this threshold suggests low economic productivity, high unemployment, and weak social safety nets.
3. Inequality and Social Vulnerability
• It reflects deep income inequality and a lack of access to opportunities for upward mobility.
• People in this category are more vulnerable to shocks like food price increases, climate disasters, or health crises.
4. Policy Challenges
• Governments need targeted interventions such as social welfare programs, job creation, and improved access to education and healthcare to reduce poverty.
A country's export structure is a reflection of its level of development and productive capacities
The export structure of a country refers to the composition, diversity, and value of the goods and services it sells to other countries. It provides key insights into the country’s economic health, competitiveness, and level of development. Productive capacities of a country refer to its ability to produce goods and services efficiently and sustainably over time. These capacities are shaped by various factors, including human capital, natural resources, infrastructure, private sector, development, technology & innovation, institutions & governance, financial systems trade & market access.
Here’s what the export structure and productive capacities of a country typically indicate:
- Level of Economic Development
- Developed economies usually export high-value manufactured goods, technology, and services.
- Developing economies often rely on raw materials, agricultural products, or low-value manufactured goods.
- Industrial and Sectoral Strengths
- A strong presence of high-tech or industrial goods (e.g., machinery, electronics) suggests a well-developed manufacturing sector.
- A dominance of commodities (e.g., oil, minerals, agricultural products) indicates reliance on natural resources.
- Export Diversification
- A diverse export base (multiple industries) makes a country’s economy more stable and resilient to global price shocks.
- A concentrated export base (few key products) makes it vulnerable to market fluctuations.
- Trade Partnerships and Dependence
- If exports are heavily dependent on a single country or region, the economy is more exposed to geopolitical and trade risks.
- A wide range of trading partners indicates stronger global integration.
- Competitiveness and Value Addition
- Exporting mainly raw materials (e.g., crude oil instead of refined petroleum) suggests limited industrial processing capacity.
- A high share of finished and high-tech goods suggests strong value addition and competitiveness.
South Africa-Sanitation
South Africa – Proportion of population served with at least basic sanitation facilities
In 2022, the proportion of the population served with at least basic sanitation in South Africa was 77.6 %. The proportion of the population served with at least basic sanitation in South Africa increased from 59.5 % in 2000 to 77.6 % in 2022, an absolute change of 18.1 percentage points (pp) between 2000 and 2022.
South Africa – Proportion of urban population served with at least basic sanitation facilities
In 2022, the proportion of the urban population served with at least basic sanitation in South Africa was 77.5 %. The proportion of urban population served with at least basic sanitation in South Africa increased from 71.0 % in 2000 to 77.5 % in 2022, an absolute change of 6.5 pp between 2000 and 2022.
South Africa – Proportion of rural population served with at least basic sanitation facilities
In 2022, the proportion of the rural population served with at least basic sanitation in South Africa was 77.9 %. The proportion of the rural population served with at least basic sanitation in South Africa increased from 44.4 % in 2000 to 77.9 % in 2022, an absolute change of 33.5 pp between 2000 and 2022.
South Africa – Proportion of population served with at least basic sanitation facilities
Unsafe sanitation continues to pose a significant challenge, leading to the tragic loss of countless lives each year. Safe sanitation is not simply an essential service; it is a basic human right that should be available to all. In 2022, only 77.6% of South Africa’s population had access to at least basic sanitation facilities, revealing a critical shortfall in public health infrastructure. In contrast, countries like China, Indonesia, Sri Lanka, Thailand, and Vietnam achieved much higher access rates, reaching 95.9%, 88.2%, 95.1%, and 99.0%, respectively. The issue of safe sanitation extends beyond mere numbers; it is crucial for health, dignity, and overall well-being. These alarming statistics highlight the pressing need for collective action to foster sustainable governance and inclusive solutions that ensure safe sanitation for everyone in Sub-Saharan Africa. Please refer to the chart below for a visual representation of these disparities.

South Africa – Proportion of population served with at least basic sanitation facilities
A significant portion of South Africa’s rural population lacks access to basic sanitation, which impacts countless lives each year and highlights the need for safe sanitation as a fundamental human right. In 2022, only 77.9 percent of the rural population had basic sanitation facilities, compared to 94.9 percent in Sri Lanka, 98.4 percent in Thailand, and 88.4 percent in Vietnam. These alarming statistics call for immediate action. It is crucial to advocate for improved sanitation infrastructure while prioritizing the health and dignity of all individuals. Our commitment to addressing these disparities is vital for sustainable development, ensuring every community has the sanitation it deserves. Together, we can create a future where safe sanitation is a reality for all, enhancing the quality of life for South Africa’s rural population.

South Africa-Water Supply
South Africa – Proportion of population served with at least basic drinking water
In 2022, the proportion of the population served with at least basic water in South Africa was 94.5 %. Proportion of population served with at least basic water in South Africa increased from 84.6 % in 2000 to 94.5 % in 2022, an absolute change of 9.9 pp between 2000 and 2022.
South Africa – Proportion of urban population served with at least basic water
.In 2022, the proportion of the urban population served with at least basic water for South Africa was 99.1 %. The proportion of the urban population served with at least basic water in South Africa increased from 98.4 % in 2000 to 99.1 % in 2022, an absolute change of 9.9 pp between 2000 and 2022.
Equatorial Guinea – Proportion of rural population served with at least basic water
In 2022, the proportion of the rural population served with at least basic water in South Africa was 84.5 %. The proportion of the rural population served with at least basic water in South Africa increased from 66.4 % in 2000 to 84.5 % in 2022, an absolute change of 18.1 pp between 2000 and 2022.
South Africa – Proportion of population served with at least basic drinking water
As of 2022, it was reported that 94.5% of South Africa’s population now has access to at least basic water services, a remarkable rise from 84.6% in 2000. However, this progress stands in stark contrast to the 100% access enjoyed in nations such as South Korea and Thailand, where safe drinking water is a common expectation. These disparities in water access extend beyond mere numbers; they underscore the real difficulties faced by communities and their impact on health, education, and quality of life. It is essential to acknowledge these inequalities and advocate for sustainable solutions and infrastructure that guarantee access to this vital resource for everyone.

South Africa – Proportion of rural population served with at least basic drinking water
As of 2022, just 84.5% of South Africa’s rural population had access to at least basic drinking water, a slight rise from 66.4% in 2000. This troubling statistic sharply contrasts with the situation in countries like Thailand and Vietnam, where safe drinking water is regarded as a basic necessity rather than a privilege. This glaring gap highlights the critical need for significant enhancements in infrastructure and resources, ensuring that everyone, irrespective of their location, can access the vital services they require. Such disparities in water availability are not just numbers; they represent profound challenges for communities, impacting health, education, and the overall quality of life for many. It is essential to address these issues to foster a healthier and more just future for everyone.

South Africa – Access to Electricity
South Africa- Access to electricity (% of population)
In 2022, the proportion of the population with access to electricity in South Africa was 86.5%. The proportion of the population with access to electricity in South Africa increased from 72.4% in 2000 to 86.5% in 2022, an absolute change of 14.1 pp between 2000 and 2022.
South Africa- Access to Electricity (% urban population)
In 2022, the proportion of the urban population with access to electricity in South Africa was 87.1%. The proportion of the urban population with access to electricity in South Africa increased from 85.6% % in 2000 to 87.1% in 2022, an absolute increase of 1.5 pp between 2000 and 2022.
South Africa- Access to electricity (% rural population)
In 2022, the proportion of the rural population with access to electricity in South Africa was 93.4%. The proportion of the rural population with access to electricity in South Africa increased from 54.9 % in 2000 to 93.4% in 2022, an absolute change of 38.5 pp between 2000 and 2022.
South Africa – Proportion of population with access to electricity: A Global Perspective
In 2022, 86.5 percent of South Africans had access to electricity, up from 72.4 percent in 2000. While this progress is notable, South Africa still trails many nations; Thailand and South Korea enjoy full access at 100 percent, while Vietnam and Bangladesh are close at nearly 99 percent. Electricity access is vital for reducing poverty and fostering economic growth. Globally, the percentage of people with electricity access has improved, dropping from 20 percent in 2000 to less than 10 percent today, particularly in low and middle-income nations. However, several Sub-Saharan African countries, including South Africa, still face challenges in achieving universal electricity access.

South Africa – Proportion of rural population with access to electricity:
Access to electricity is a vital resource that transforms lives and drives economic development. Since 2000, the global population without electricity has fallen from 20 percent to under 10 percent, mainly due to progress in low and middle-income countries. In rural South Africa, access jumped from 54.9 percent in 2000 to 93.4 percent in 2022. However, the journey to universal access still continues. Our chart allows you to compare rural South Africa’s electrification rates with those of other developing nations. By 2022, while South Africa’s rural areas reached 93.4 percent access, countries like Vietnam, Thailand, South Korea, Malaysia, and China achieved full electricity access, underscoring the urgent need for collective efforts to ensure everyone benefits from electricity.

South Africa – Health Outcomes
South Africa – Life expectancy: A Global Perspective
Over the past seven decades, the global landscape of life expectancy has undergone substantial transformation, with populations increasingly experiencing extended lifespans. In the year 1950, the global average life expectancy for newborns was merely 47 years, a statistic that escalated to 71 years by 2021. Nevertheless, in several Sub-Saharan African countries, advancements have been less pronounced. Specifically, in South Africa, life expectancy demonstrated a gradual rise from 53 years in 1960 to 62 years in 2022. In stark contrast, the Maldives exhibited a striking improvement in life expectancy during the same timeframe, surging from 39 years in 1960 to an impressive 81 years by 2022. A visual representation offering comparative insights with other developing nations is available in the chart below.


South Africa – Mortality rates, under-5 ( per 1000 live births): A Global Perspective
Since the mid-20th century, the global child mortality rate has experienced a significant decline, attributed to improvements in living conditions, accessibility to healthcare, enhanced nutritional standards, and the provision of safe drinking water. In the most affluent regions of Europe and America, child mortality has decreased to less than 4 percent. Throughout the past seventy years, notable progress has also been observed in multiple developing nations across South America and Asia; however, several countries in Sub-Saharan Africa continue to lag in these advancements. For instance, in 1990, the under-five mortality rates in South Africa and Bangladesh were recorded at 62.3 and 146, respectively. By 2022, these statistics demonstrated substantial improvement, with South Africa at 34.5 and Bangladesh at 29.


South Africa – Maternal mortality rates ( per 100,000 live births): A Global Perspective
In the chart below, we present an analysis of the annual incidence of pregnancy-related deaths by country, illuminating the distressing reality that a significant proportion of these fatalities occur within Sub-Saharan Africa. This phenomenon can be attributed not only to the heightened birth rates prevalent in this region but also to the persistently high maternal mortality rates. Noteworthy advancements are observed in South Africa, where maternal deaths have declined from 173 in 2000 to 127 in 2022. Conversely, India has achieved considerable progress, with maternal deaths decreasing from 384 in 2000 to 103 in 2022. In 2022, South Africa reported 127 maternal deaths, which starkly contrasts with the considerably lower figures of 29 and 8 recorded in Thailand and South Korea, respectively. For a visual representation of these disparities, please refer to the chart below.

