Namibia
Country Flag Details
a wide red stripe edged by narrow white stripes divides the flag diagonally from lower hoist corner to upper fly corner; the upper hoist-side triangle is blue and charged with a golden-yellow, 12-rayed sunburst; the lower fly-side triangle is green; red signifies the heroism of the people and their determination to build a future of equal opportunity for all; white stands for peace, unity, tranquility, and harmony; blue represents the Namibian sky and the Atlantic Ocean, the country’s precious water resources and rain; the golden-yellow sun denotes power and existence; green symbolizes vegetation and agricultural resources.
Background
South Africa occupied modern-day Namibia, then known as German South West Africa, in 1915 during World War I and administered it as a mandate until after World War II. In 1966, the Marxist South-West Africa People’s Organization (SWAPO) guerrilla group launched a war of independence for the area that became Namibia. Namibia gained independence in 1990, and SWAPO has governed it since, though the party has dropped much of its Marxist ideology.
Geography
Area
total : 824,292 sq km
land: 823,290 sq km
water: 1,002 sq km
Climate
desert; hot, dry; rainfall sparse and erratic
Natural resources
diamonds, copper, uranium, gold, silver, lead, tin, lithium, cadmium, tungsten, zinc, salt, hydropower, fish
People and Society
Population
total: 2,803,660
Ethnic groups
Ovambo 50%, Kavangos 9%, Herero 7%, Damara 7%, mixed European and African ancestry 6.5%, European 6%, Nama 5%, Caprivian 4%, San 3%, Baster 2%, Tswana 0.5%
Languages
Oshiwambo languages 49.7%, Nama/Damara 11%, Kavango languages 10.4%, Afrikaans 9.4%, Herero languages 9.2%, Zambezi languages 4.9%, English (official) 2.3%, other African languages 1.5%, other European languages 0.7%, other 1% (2016 est.)
Religions
Christian 97.5%, other 0.6% (includes Muslim, Baha’i, Jewish, Buddhist), unaffiliated 1.9% (2020 est.)
Population growth rate
1.72% (2024 est.)
Government
Government type
presidential republic
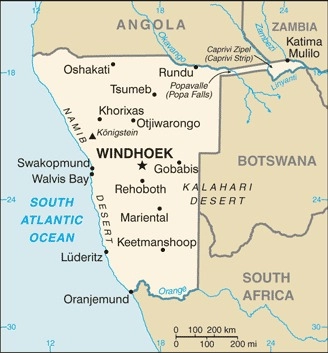
Capital name: Windhoek
Executive branch
chief of state: Acting President Nangolo MBUMBA (since 4 February 2024)
head of government: Acting President Nangolo MBUMBA (since 4 February 2024)
Economy
Economic overview
upper middle-income, export-driven Sub-Saharan economy; natural resource rich; Walvis Bay port expansion for trade; high potential for renewable power generation and energy independence; major nature-based tourist locale; natural resource rich; shortage of skilled labor
Real GDP (purchasing power parity)
$29.944 billion (2023 est.)
$28.748 billion (2022 est.)
$27.288 billion (2021 est.)
Real GDP per capita
$10,100 (2023 est.)
$9,900 (2022 est.)
$9,700 (2021 est.)
Exports
$5.691 billion (2023 est.)
$5.361 billion (2022 est.)
$4.353 billion (2021 est.)
Exports – partners
South Africa 27%, China 12%, Botswana 8%, Belgium 7%, France 5% (2023)
Exports – commodities
gold, diamonds, radioactive chemicals, fish, refined petroleum (2023)
Imports
$8.283 billion (2023 est.)
$7.424 billion (2022 est.)
$6.466 billion (2021 est.)
Imports – partners
South Africa 36%, China 9%, India 7%, UAE 4%, USA 3% (2023)
Imports – commodities
refined petroleum, copper ore, ships, electricity, trucks (2023)
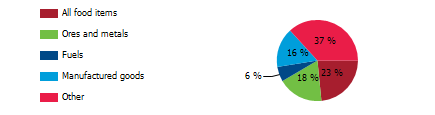
Export structure by product group in 2023 (% of total exports) (UNCTAD)
The export structure of a nation serves as a vital indicator of the diversity, composition, and economic value of the goods and services it trades on the global stage, offering profound insights into its economic health, competitive position, and developmental status. In Namibia, this export framework is significantly marked by a heavy dependence on mineral resources, especially diamonds and uranium, which constitute a substantial portion of the country’s international trade; additionally, the fishing industry contributes meaningfully to this economic landscape. To ensure sustainable economic growth in Namibia, it is crucial to implement effective diversification strategies and to judiciously manage emerging resource discoveries, thereby fostering resilience and stability in the face of fluctuating global markets.
Poverty and vulnerable employment in Namibia
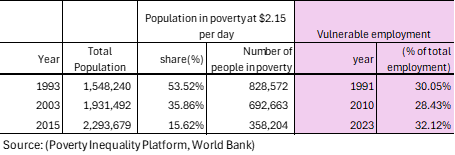
In 2023, a significant 32 percent of total employment in Namibia was identified as vulnerable, a classification that encapsulates work characterized by inadequate job security, meager wages, and insufficient access to essential social protections such as health insurance, pensions, or labor rights. This category predominantly includes own-account workers, who are self-employed without any employees, including street vendors and small-scale farmers, along with contributing family workers, who provide support in family-run businesses or farms without receiving formal remuneration. These roles often exist in informal and unstable conditions, which render workers acutely susceptible to economic shocks, exploitation, and the persistent threat of poverty. The implications of such vulnerable employment reach far beyond the individual, impacting entire families and communities, and fostering enduring cycles of instability and hardship that are profoundly difficult to escape.
Understanding poverty level significance at $2.15 per day
In 2015, 16 percent of the population of Namibia ( 358,204 people) livid in poverty at $2.15 per day. The poverty level at $2.15 per day (measured in 2017 purchasing power parity, or PPP) is a key global benchmark used by the World Bank to define extreme poverty in low-income countries. It indicates:
1. Basic Survival Threshold
• People living below $2.15 per day struggle to afford essential needs such as food, clean water, shelter, healthcare, and education.
2. Economic Underdevelopment
• A high percentage of a country’s population living below this threshold suggests low economic productivity, high unemployment, and weak social safety nets.
3. Inequality and Social Vulnerability
• It reflects deep income inequality and a lack of access to opportunities for upward mobility.
• People in this category are more vulnerable to shocks like food price increases, climate disasters, or health crises.
4. Policy Challenges
• Governments need targeted interventions such as social welfare programs, job creation, and improved access to education and healthcare to reduce poverty.
A country's export structure is a reflection of its level of development and productive capacities
The export structure of a country refers to the composition, diversity, and value of the goods and services it sells to other countries. It provides key insights into the country’s economic health, competitiveness, and level of development. Productive capacities of a country refer to its ability to produce goods and services efficiently and sustainably over time. These capacities are shaped by various factors, including human capital, natural resources, infrastructure, private sector, development, technology & innovation, institutions & governance, financial systems trade & market access.
Here’s what the export structure and productive capacities of a country typically indicate:
- Level of Economic Development
- Developed economies usually export high-value manufactured goods, technology, and services.
- Developing economies often rely on raw materials, agricultural products, or low-value manufactured goods.
- Industrial and Sectoral Strengths
- A strong presence of high-tech or industrial goods (e.g., machinery, electronics) suggests a well-developed manufacturing sector.
- A dominance of commodities (e.g., oil, minerals, agricultural products) indicates reliance on natural resources.
- Export Diversification
- A diverse export base (multiple industries) makes a country’s economy more stable and resilient to global price shocks.
- A concentrated export base (few key products) makes it vulnerable to market fluctuations.
- Trade Partnerships and Dependence
- If exports are heavily dependent on a single country or region, the economy is more exposed to geopolitical and trade risks.
- A wide range of trading partners indicates stronger global integration.
- Competitiveness and Value Addition
- Exporting mainly raw materials (e.g., crude oil instead of refined petroleum) suggests limited industrial processing capacity.
- A high share of finished and high-tech goods suggests strong value addition and competitiveness.
Namibia-Sanitation
Namibia – Proportion of population served with at least basic sanitation
In 2022, the proportion of the population served with at least basic sanitation in Namibia was 35.8 %. The proportion of the population served with at least basic sanitation in Namibia increased from 28.1 % in 2000 to 35.8 % in 2022, an absolute increase of 7.7 percentage points (pp) between 2000 and 2022.
Namibia – Proportion of urban population served with at least basic sanitation facilities
In 2022, the proportion of the urban population served with at least basic sanitation in Namibia was 49.7 %. The proportion of the urban population served with at least basic sanitation in Namibia declined from 59.5% in 2000 to 49.7% in 2022, an absolute change of 9.8 pp between 2000 and 2022.
Namibia – Proportion of rural population served with at least basic sanitation facilities
In 2022, the proportion of the rural population served with at least basic sanitation in Namibia was 19.6 %. The proportion of the rural population served with at least basic sanitation in Namibia increased from 13.0 % in 2000 to 19.6 % in 2022 , an absolute change of 6.6 pp between 2000 and 2022.
Namibia – Proportion of population served with at least basic sanitation
Unsafe sanitation is a pressing issue causing the tragic loss of countless lives annually. Access to safe sanitation is a fundamental necessity and a basic human right. In 2022, only 35.8 percent of Namibia’s population had access to at least basic sanitation facilities, highlighting a critical gap in public health infrastructure. In contrast, countries like China, Indonesia, Sri Lanka, Thailand, and Vietnam reported much higher access rates of 95.9 percent, 88.2 percent, 95.1 percent, and 99.0 percent, respectively. Ensuring safe sanitation is crucial for health, dignity, and overall well-being, underscoring the urgent need for collective action to promote sustainable governance and inclusive strategies that guarantee safe sanitation for all in Sub-Saharan Africa.

Namibia – Proportion of rural population served with at least basic sanitation
Many individuals in Namibia’s rural areas face a critical challenge due to the lack of basic sanitation, a crisis that affects countless lives each year and emphasizes safe sanitation as a fundamental human right. In 2022, only 19.6 percent of the rural population had access to basic sanitation, a stark contrast to higher rates of 94.9 percent in Sri Lanka, 98.4 percent in Thailand, and 88.4 percent in Vietnam. These alarming figures highlight the urgent need for action. We must advocate for improved sanitation infrastructure to prioritize the health and dignity of all individuals. Our commitment to addressing these inequalities is crucial for sustainable development, ensuring every community receives the sanitation they deserve, and together we can create a future where safe sanitation is accessible to all, enhancing the quality of life for Namibia’s rural population.

Namibia-Water Supply
Namibia – Proportion of total population served with at least basic drinking water
In 2022, the proportion of the population served with at least basic water in Namibia was 85.9 %. The proportion of the population served with at least basic water in Namibia increased from 76.0 % in 2000 to 85.9 % in 2022, an absolute change of 9.9 pp between 2000 and 2022.
Namibia – Proportion of urban population served with at least basic drinking water
In 2022, the proportion of the urban population served with at least basic drinking water in Namibia was 96.2 %. The proportion of the urban population served with at least basic drinking water in Namibia decreased from 98.0% in 2000 to 96.2% in 2022, an absolute change of 1.8 pp between 2000 and 2022.
Namibia – Proportion of rural population with at least basic drinking water
In 2022, the proportion of the rural population served with at least basic water in Namibia was 73.8 %. The proportion of the rural population served with at least basic drinking water in Namibia increased from 65.4% in 2000 to 73.8 % in 2022, an absolute change of 8.4 pp between 2000 and 2022.
Namibia – Proportion of total population served with at least basic drinking water
Access to safe drinking water is a fundamental human right that everyone deserves. In 2022, around 14 percent of Namibia’s population lacked this essential resource, highlighting a stark contrast with Vietnam, where everyone has access to safe drinking water. This disparity underscores the urgent challenges facing communities in Namibia and the pressing need for improved water infrastructure and management. It also raises important discussions about global equity in water access, reminding us of our collective responsibility to ensure that all individuals, regardless of their location, can enjoy the right to clean and safe drinking water.

Namibia – Proportion of total population served with at least basic drinking water
In 2022, it was reported that a staggering 26 percent of Namibia’s rural population faced the harsh reality of lacking access to essential drinking water facilities, highlighting a critical and persistent challenge in the areas of water accessibility and public health throughout this region. This situation stands in stark contrast to Vietnam, where the rural population proudly celebrated a remarkable achievement: attaining an impressive 100 percent reliable access to safe drinking water within the same year. This success serves as a powerful testament to the effectiveness of robust infrastructure and sound governance, as illustrated in the accompanying chart, which sheds light on the disparities in water access and the urgent need for continued efforts to address these issues in Namibia.

Namibia-Access to Electricity
Namibia- Access to Electricity (% of population)
In 2022, the proportion of the rural population with access to electricity in Namibia was 56.2 %. The proportion of the population with access to electricity in Namibia increased from 36.5% in 2000 to 56.2% in 2022, an absolute change of 19.7 pp between 2000 and 2022.
Namibia -Access to Electricity (% urban population)
In 2022, the proportion of the urban population with access to electricity in Namibia was 74.8 %. The proportion of the urban population with access to electricity in Namibia increased from 73.2% % in 2000 to 74.8% in 2022, an absolute change of 1.6 pp between 2000 and 2022.
Namibia- Access to Electricity (% rural population)
In 2022, the proportion of the rural population with access to electricity in Namibia was 33.2 %. The proportion of the rural population with access to electricity in Namibia increased from 18.9% in 2000 to 33.2% in 2022, an absolute change of 14.3 pp between 2000 and 2022.
Namibia- Proportion of population with access to electricity (%): A Global Perspective
In 2022, a mere 56.2% of Namibia’s population had reliable access to electricity, illustrating a concerning reality where nearly half of the populace lacks this essential resource, which is crucial for improving quality of life and stimulating economic growth. This stark contrast is further highlighted by Vietnam’s remarkable achievement of universal access, with every citizen enjoying the benefits of electricity, a fundamental asset that supports advancements in education, healthcare, and industrial development. Meanwhile, the global average stands at 91.4%, underscoring the stark disparities in energy availability that persist across different regions, ultimately impacting the potential for progress and prosperity in various communities.

Namibia- Proportion of rural population with access to electricity (%): A Global Perspective
The chart below poignantly illustrates the deep disparities in access to electricity faced by rural communities in Namibia compared to their counterparts in other developing nations. In 2022, a mere 33.2% of the rural population in Namibia had access to electricity, highlighting the significant challenges these communities endure. In contrast, rural populations in countries like South Korea, Sri Lanka, Thailand, and Malaysia enjoyed full access at 100% during the same year. We encourage you to take a moment to explore the chart below, as recognizing these differences is crucial for nurturing global empathy and inspiring meaningful action.

Namibia- Health outcomes
Namibia-Life expectancy: A Global Perspective
Over the past seven decades, there have been notable advancements in global life expectancy, resulting in significantly longer lifespans for populations worldwide. In 1950, the average life expectancy for a newborn was merely 47 years, a figure that rose to 71 years by 2021. Nonetheless, progress has been uneven, particularly in several sub-Saharan African nations. For example, life expectancy in Namibia increased from 48 years in 1960 to 58 years in 2022. In stark contrast, the Maldives experienced a remarkable surge in life expectancy, climbing from 39 years in 1960 to 81 years in 2022, as depicted in the accompanying chart for comparative analysis.


Namibia – Mortality rates, under-5 ( per 100,000 live births): A Global Perspective
Since 1950, there has been a substantial decline in child mortality rates on a global scale, attributable to advancements in living standards, healthcare, nutrition, and the provision of clean drinking water. In affluent regions of Europe and America, child mortality has diminished to under 4 percent. Throughout the past seven decades, numerous developing countries in South America and Asia have also achieved significant progress. Conversely, several Sub-Saharan African nations have experienced more gradual improvements. For example, in 1990, the reported child mortality rates in Namibia and Bangladesh were 73.3 percent and 146 percent, respectively; by 2022, these figures had improved to 37.9 percent for Namibia and 29 percent for Bangladesh. In summary, the global child mortality rate has dramatically decreased from 22.7 percent in 1950 to 3.6 percent in 2023.

Namibia – Mortality rates, under-5 ( per 1000 live births): A Global Perspective
The chart below illustrates the annual maternal mortality rates associated with pregnancy across various regions and countries, highlighting a stark reality wherein the majority of these fatalities occur in Sub-Saharan Africa. This troubling trend can be attributed to both the high birth rates prevalent in the region and the significantly elevated maternal mortality figures. Remarkably, Namibia has made strides in addressing this crisis, with maternal deaths decreasing from 450 in 2000 to 215 in 2022. In contrast, South Korea and Thailand reported significantly lower maternal death rates of 8 and 29 respectively in 2022. For a comprehensive comparison of Namibia with other developing nations, please refer to the chart below.
