Lesotho
Country Flag Details
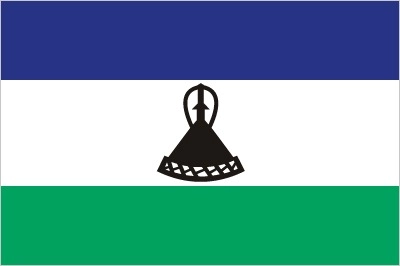
three horizontal stripes of blue (top), white, and green in the proportions of 3:4:3; the colors represent rain, peace, and prosperity respectively; centered in the white stripe is a black mokorotlo, a traditional Basotho straw hat and national symbol; the redesigned flag was unfurled in October 2006 to celebrate 40 years of independence.
Background
Basutoland became Lesotho after gaining independence from the UK in 1966. Constitutional reforms in the late 1990s restored relative political stability.
Geography
Area
total : 30,355 sq km
land: 30,355 sq km
water: 0 sq km
Climate
temperate; cool to cold, dry winters; hot, wet summers
Natural resources
water, agricultural and grazing land, diamonds, sand, clay, building stone
People and Society
Population
total: 2,227,548
Ethnic groups
Sotho 99.7%, other 0.3% (includes Kwena, Nguni (Hlubi and Phuthi), Zulu)
Languages
Sesotho (official), English (official), Phuthi, Xhosa, Zulu
Religions
Protestant 47.8% (Pentecostal 23.1%, Lesotho Evangelical 17.3%, Anglican 7.4%), Roman Catholic 39.3%, other Christian 9.1%, non-Christian 1.4%, none 2.3% (2014 est.)
Population growth rate
0.76% (2024 est.)
Government
Government type
parliamentary constitutional monarchy
Capital name: Maseru
Executive branch
chief of state: King LETSIE III (since 7 February 1996)
head of government: Prime Minister Ntsokoane Samuel MATEKANE (28 October 2022)
Economy
Economic overview
lower middle-income economy surrounded by South Africa; environmentally fragile and politically unstable; key infrastructure and renewable energy investments; dire poverty; urban job and income losses due to COVID-19; systemic corruption
Real GDP (purchasing power parity)
$6 billion (2023 est.)
$5.893 billion (2022 est.)
$5.755 billion (2021 est.)
Real GDP per capita
$2,600 (2023 est.)
$2,600 (2022 est.)
$2,500 (2021 est.)
Exports
$885.789 million (2023 est.)
$1.07 billion (2022 est.)
$1.082 billion (2021 est.)
Exports – partners
South Africa 31%, Belgium 26%, USA 20%, UAE 8%, India 8% (2023)
Exports – commodities
diamonds, garments, wool, power equipment, bedding (2023)
Imports
$2.074 billion (2023 est.)
$2.244 billion (2022 est.)
$2.223 billion (2021 est.)
Imports – partners
South Africa 78%, China 10%, Taiwan 3%, Japan 1%, India 1% (2023)
Imports – commodities
refined petroleum, fabric, trucks, garments, cotton fabric (2023)
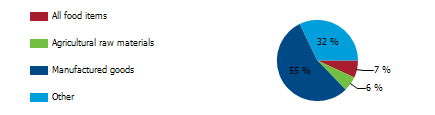
Export structure by product group in 2023 (% of total exports) (UNCTAD)
The export structure of a country is a vital indicator reflecting the variety, composition, and monetary worth of its goods and services exchanged on the international stage, offering deep insights into its economic vitality, global competitiveness, and overall development stage. In the case of Lesotho, its export profile is notably intricate, with diamonds and textiles serving as the cornerstone of its trade dynamics. Although the nation reaps the advantages of favorable trade partnerships, it is essential to confront the persistent trade deficit by prioritizing diversification and enhancing value addition, which are crucial steps toward achieving sustained economic growth and prosperity for the country.
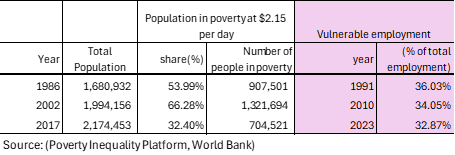
Poverty and vulnerable employment in Lesotho (World Bank)
In the year 2023, it was documented that 33 percent of the total employment in Lesotho fell under the classification of vulnerable employment, which is characterized by insufficient job security, low remuneration, and a notable absence of social safeguards, including health insurance, pensions, and labor rights. This classification encompasses two primary categories: own-account workers, who are individuals engaged in self-employment without any employees, such as street vendors and small-scale farmers, and contributing family workers, who operate within family-owned businesses or farms without receiving formal compensation. Employment positions within these categories are frequently informal and precarious, devoid of essential benefits, thus rendering the workforce particularly vulnerable to economic fluctuations, exploitation, and poverty. The ramifications of such employment extend beyond individual circumstances, adversely affecting families and communities at large and reinforcing enduring cycles of instability and hardship that prove difficult to transcend.
Understanding poverty level significance at $2.15 per day
In 2017, 32 percent of the population in Lesotho lived in poverty at $2.15 per day. The poverty level at $2.15 per day (measured in 2017 purchasing power parity, or PPP) is a key global benchmark used by the World Bank to define extreme poverty in low-income countries. It indicates:
1. Basic Survival Threshold
• People living below $2.15 per day struggle to afford essential needs such as food, clean water, shelter, healthcare, and education.
2. Economic Underdevelopment
• A high percentage of a country’s population living below this threshold suggests low economic productivity, high unemployment, and weak social safety nets.
3. Inequality and Social Vulnerability
• It reflects deep income inequality and a lack of access to opportunities for upward mobility.
• People in this category are more vulnerable to shocks like food price increases, climate disasters, or health crises.
4. Policy Challenges
• Governments need targeted interventions such as social welfare programs, job creation, and improved access to education and healthcare to reduce poverty.
A country's export structure is a reflection of its level of development and productive capacities
The export structure of a country refers to the composition, diversity, and value of the goods and services it sells to other countries. It provides key insights into the country’s economic health, competitiveness, and level of development. Productive capacities of a country refer to its ability to produce goods and services efficiently and sustainably over time. These capacities are shaped by various factors, including human capital, natural resources, infrastructure, private sector, development, technology & innovation, institutions & governance, financial systems trade & market access.
Here’s what the export structure and productive capacities of a country typically indicate:
- Level of Economic Development
- Developed economies usually export high-value manufactured goods, technology, and services.
- Developing economies often rely on raw materials, agricultural products, or low-value manufactured goods.
- Industrial and Sectoral Strengths
- A strong presence of high-tech or industrial goods (e.g., machinery, electronics) suggests a well-developed manufacturing sector.
- A dominance of commodities (e.g., oil, minerals, agricultural products) indicates reliance on natural resources.
- Export Diversification
- A diverse export base (multiple industries) makes a country’s economy more stable and resilient to global price shocks.
- A concentrated export base (few key products) makes it vulnerable to market fluctuations.
- Trade Partnerships and Dependence
- If exports are heavily dependent on a single country or region, the economy is more exposed to geopolitical and trade risks.
- A wide range of trading partners indicates stronger global integration.
- Competitiveness and Value Addition
- Exporting mainly raw materials (e.g., crude oil instead of refined petroleum) suggests limited industrial processing capacity.
- A high share of finished and high-tech goods suggests strong value addition and competitiveness.
Lesotho-Sanitation
Lesotho- Proportion of population served with at least basic sanitation
In 2022, the proportion of the population served with at least basic sanitation for Lesotho was 50.3 %. The proportion of the population served with at least basic sanitation in Lesotho increased from 8.1 % in 2000 to 50.3 % in 2022, an absolute change of 42.2 percentage points (pp) increase between 2000 and 2022.
Lesotho – Proportion of urban population served with at least basic sanitation facilities
In 2022, the proportion of urban population served with at least basic sanitation for Lesotho was 47.3 %. The proportion of the urban population served with at least basic sanitation in Lesotho increased from 21.3 % in 2000 to 47.3 % in 2022, an absolute change of 26 pp between 2000 and 2022.
Lesotho – Proportion of rural population served with at least basic sanitation facilities
In 2022, the proportion of the rural population served with at least basic sanitation in Lesotho was 55.6 %. The proportion of the rural population served with at least basic sanitation in Lesotho increased from 4.8 % in 2000 to 55.6 % in 2022, an absolute change of 50.8 pp increase between 2000 and 2022.
Lesotho-Share of the population using at least basic sanitation facilities: A Global Perspective
Unsafe sanitation remains a tragic issue, causing countless deaths each year. Access to safe sanitation is not just a necessity; it is a fundamental human right. In 2022, only 50.3% of the population in Lesotho had access to basic sanitation facilities, exposing a significant gap in public health. In comparison, countries like China, Indonesia, Sri Lanka, Thailand, and Vietnam reported access rates as high as 99.0%. The struggle for safe sanitation is more than statistics; it is essential for health, dignity, and well-being. These alarming figures call for urgent collective action towards sustainable governance and inclusive solutions to ensure safe sanitation for everyone in Sub-Saharan Africa.

Lesotho- Share of the rural population served with at least basic sanitation
The chart below highlights a critical issue facing many individuals in rural Lesotho who lack access to basic sanitation. This overlooked crisis impacts lives yearly and underscores the necessity for safe sanitation as a fundamental human right. In 2022, only 55.6% of this population had basic sanitation, compared to 94.9% in Sri Lanka, 98.4% in Thailand, and 88.4% in Vietnam. These alarming statistics present a clear call to action. We encourage you to consult the chart for a visual understanding of these disparities. It is essential to advocate for improved sanitation infrastructure and prioritize the health and dignity of every person. Our dedication to addressing these inequities is vital for sustainable development, ensuring all communities receive the sanitation services they deserve. Together, we can work towards a future where safe sanitation is a reality for everyone, improving the quality of life for rural communities in Lesotho.

Lesotho-Water Supply
Lesotho – Proportion of population served with at least basic drinking water
In 2022, the proportion of the population served with at least basic water in Lesotho was 74 %. The proportion of the population served with at least basic drinking water of Lesotho increased from 65.6 % in 2000 to 74 % in 2022 , an absolute change of 8.4 pp between 2000 and 2022.
Lesotho – Proportion of urban population served with at least basic water
In 2022, the proportion of the urban population served with at least basic water in Lesotho was 93.0 %. The proportion of urban population served with at least basic drinking water in Lesotho increased from 80.9 % in 2000 to 93 % in 2022, an absolute change of 12.1 pp between 2000 and 2022.
Lesotho – Proportion of rural population served with at least basic drinking water
In 2022, the proportion of the rural population served with at least basic water in Lesotho was 65.9 %. Proportion of rural population served with at least basic drinking water in Lesotho increased from 61.9 % in 2000 to 65.9 % in 2022, an absolute increase of 4.0 pp between 2000 and 2022.
Lesotho – Proportion of Total Population Served with at Least Basic Water: A Global Perspective
As of 2022, 74% of the population in Lesotho had access to at least basic drinking water services. This represents a modest increase from just 65.6% in the year 2000. Yet, this progress starkly contrasts with the 100% access enjoyed by populations in countries like South Korea and Thailand, where safe drinking water is a given. These disparities in water accessibility are more than mere statistics; they reflect the real challenges that communities face, impacting health, education, and overall quality of life. We must acknowledge these inequalities and champion sustainable solutions and infrastructure that can guarantee every individual access to this vital resource.

Lesotho – Share of the Rural Population Using at Least Basic Drinking Water Facilities
In 2022, 65.9% of the rural population in Lesotho had access to basic drinking water services, marking a modest rise from 61.9% in 2000. Yet, this progress starkly contrasts with the 100% access enjoyed by rural populations in countries like South Korea and Thailand, where safe drinking water is a given. This persistent disparity underscores the critical need for enhanced infrastructure and the allocation of necessary resources to guarantee that all individuals have reliable access to essential services. It is imperative that we confront and resolve these pressing issues, as doing so is vital for cultivating a healthier, more equitable future where everyone can thrive and succeed.

Lesotho-Access to Electricity
Lesotho- Access to electricity (% of population)
In 2022, the proportion of the population with access to electricity in Lesotho was 50%. The proportion of the population with access to electricity in Lesotho increased from 4.3% in 2000 to 50% in 2022, an absolute change of 45.7 pp between 2000 and 2022.
Lesotho- Access to Electricity (% urban population)
In 2022, the proportion of the urban population with access to electricity in Lesotho was 83.6 %. The proportion of urban population with access to electricity in Lesotho increased from 13.6% % in 2000 to 83.6% in 2022, an absolute change of 70.0 pp between 2000 and 2022.
Lesotho- Access to electricity (% rural population)
In 2022,the proportion of the rural population with access to electricity in Lesotho was 37.7%. The proportion of the rural population with access to electricity in Lesotho increased from 2 %in 2000 to 37.7% in 2022, an absolute change of 35.7 pp between 2000 and 2022.
Lesotho- Access to electricity (% of the Population): A Global Perspective.
In 2022, 50.0% of Lesotho’s population had access to electricity, a significant increase from 4.3% in the year 2000; however, this achievement still leaves Lesotho trailing behind many other nations. Countries such as Thailand and South Korea have attained a remarkable milestone of 100% electricity access, while Vietnam and Bangladesh are close behind at nearly 99%. Access to electricity is not merely a convenience but an essential requirement for poverty alleviation and economic development. Globally, the proportion of individuals with access to electricity has steadily increased, declining from 20% in 2000 to below 10% today, especially in low and middle-income countries. Nonetheless, despite this overall progress, several nations in Sub-Saharan Africa, including Lesotho, face considerable obstacles in achieving comprehensive electricity access.

Lesotho-Access to electricity (% of the rural population): A Global Perspective
Access to electricity is a vital lifeline that transforms lives, lifts communities from poverty, and drives economic growth. Accurately measuring electricity access is key to understanding social and economic progress. Since 2000, global electricity access has improved significantly, dropping from 20% of the population without access to below 10% today, largely due to advancements in low and middle-income countries. However, the journey toward universal access is not complete, with many regions still facing inadequate supply. In rural Lesotho, only 37.7% of the population had electricity access as of 2022, up from 2% in 2000. In contrast, communities in Vietnam, Thailand, South Korea, Malaysia, and China achieved 100% access in the same year, underscoring the urgent need for action to ensure that everyone benefits from electricity’s transformative power.

Lesotho: Health outcomes
Lesotho: Life expectancy: A Global Perspective
In the last seven decades, global life expectancy has seen remarkable improvements, allowing people around the world to live longer and healthier lives. In 1950, the average life expectancy for newborns across the globe was only 47 years, but by 2021, it had risen to 71 years. Nonetheless, many nations in Sub-Saharan Africa have experienced limited progress. For example, Lesotho’s life expectancy only slightly increased from 50 years in 1960 to 53 years in 2022. In sharp contrast, the Maldives enjoyed an extraordinary surge in life expectancy, leaping from 39 years in 1960 to an impressive 81 years in 2022. Refer to the chart below for a visual comparison of Lesotho with other developing nations.

Lesotho- Under-5 mortality rate (per 1000 births): A Global perspective
Since 1950, the global under-5 mortality rate has seen significant declines, attributed to improvements in living standards, healthcare, nutrition, and access to safe drinking water. Over the past seven decades, many developing nations in South America, Asia, and North Africa have made notable strides. However, progress in most Sub-Saharan African countries has been relatively gradual. For instance, in 1990, under-5 mortality rates in Lesotho and Bangladesh were recorded at 85.1 and 146 respectively, whereas by 2022, these figures had changed to 72.2 for Lesotho and 29 for Bangladesh.

Lesotho-Maternal mortality ratio (per 100,000 live births): A Global Perspective
In the chart below, we examine the annual number of pregnancy-related deaths by region and country, revealing a troubling trend in Sub-Saharan Africa where the majority of these fatalities occur. This alarming statistic stems not only from a higher birth rate in the region but also from significantly elevated maternal mortality rates. For instance, the number of maternal deaths in Lesotho rose from 545 in 2000 to 566 in 2020, highlighting a persistent challenge. In stark contrast, Bangladesh has made notable progress, with maternal deaths decreasing from 441 in 2000 to 123 in 2020. A careful review of the chart below will provide a visual comparison of these critical figures.
