Zambia
Country Flag Details
green field with a panel of three vertical bands of red (hoist side), black, and orange below a soaring orange eagle, on the outer edge of the flag; green stands for the country’s natural resources and vegetation, red symbolizes the struggle for freedom, black the people of Zambia, and orange the country’s mineral wealth; the eagle represents the people’s ability to rise above the nation’s problems.
Background
Multiple waves of Bantu-speaking groups moved into what is now Zambia over the past thousand years. In the 1880s, the British began securing mineral and other economic concessions from local leaders, and the territory eventually became a British colonial state known as Northern Rhodesia. The name was changed to Zambia upon independence in 1964.

Geography
Area
total : 752,618 sq km
land: 743,398 sq km
water: 9,220 sq km
Climate
tropical; modified by altitude; rainy season (October to April)
Natural resources
copper, cobalt, zinc, lead, coal, emeralds, gold, silver, uranium, hydropower
People and Society
Population
total: 20,799,116
Ethnic groups
Bemba 21%, Tonga 13.6%, Chewa 7.4%, Lozi 5.7%, Nsenga 5.3%, Tumbuka 4.4%, Ngoni 4%, Lala 3.1%, Kaonde 2.9%, Namwanga 2.8%, Lunda (north Western) 2.6%, Mambwe 2.5%, Luvale 2.2%, Lamba 2.1%, Ushi 1.9%, Lenje 1.6%, Bisa 1.6%, Mbunda 1.2%, other 13.8%, unspecified 0.4% (2010 est.)
Languages
Bemba 33.4%, Nyanja 14.7%, Tonga 11.4%, Lozi 5.5%, Chewa 4.5%, Nsenga 2.9%, Tumbuka 2.5%, Lunda (North Western) 1.9%, Kaonde 1.8%, Lala 1.8%, Lamba 1.8%, English (official) 1.7%, Luvale 1.5%, Mambwe 1.3%, Namwanga 1.2%, Lenje 1.1%, Bisa 1%, other 9.7%, unspecified 0.2% (2010 est.)
Religions
Protestant 75.3%, Roman Catholic 20.2%, other 2.7% (includes Muslim, Buddhist, Hindu, and Baha’i), none 1.8% (2010 est.)
Population growth rate
2.83% (2024 est.)
Government
Government type
presidential republic
Capital name: Lusaka
Executive branch
chief of state: President Hakainde HICHILEMA (since 24 August 2021)
head of government: President Hakainde HICHILEMA (since 24 August 2021)
Economy
Economic overview
lower-middle-income sub-Saharan economy; regional hydroelectricity producer; trade ties and infrastructure investments from China; IMF assistance to restructure debt burden; one of youngest and fastest-growing labor forces; systemic corruption; extreme rural poverty
Real GDP (purchasing power parity)
$76.129 billion (2023 est.)
$72.251 billion (2022 est.)
$68.672 billion (2021 est.)
Real GDP per capita
$3,700 (2023 est.)
$3,600 (2022 est.)
$3,500 (2021 est.)
Exports
$11.454 billion (2023 est.)
$12.444 billion (2022 est.)
$11.728 billion (2021 est.)
Exports – partners
Switzerland 27%, China 15%, India 13%, UAE 12%, DRC 10% (2023)
Exports – commodities
raw copper, refined copper, gold, precious stones, electricity (2023)
Imports
$10.854 billion (2023 est.)
$10.022 billion (2022 est.)
$7.691 billion (2021 est.)
Imports – partners
South Africa 25%, China 15%, UAE 10%, India 5%, Japan 5% (2023)
Imports – commodities
refined petroleum, fertilizers, trucks, sulphur, tractors (2023)
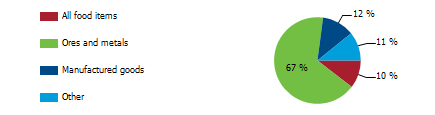
Export structure by product group in 2023 (% of total exports) (UNCTAD)
The export structure of a nation encompasses the diversity, composition, and monetary value of its goods and services exchanged in the international marketplace, providing essential insights into the economic robustness, competitive standing, and developmental phase of the country. In the case of Zambia, the export framework is predominantly characterized by copper, supplemented significantly by gold and precious stones. Although these commodities have historically underpinned the economy, there is an increasing acknowledgment of the imperative to diversify the export base. Strategic initiatives aimed at enhancing agricultural production, bolstering manufacturing capabilities, and fostering stronger mineral trading alliances represent significant efforts toward establishing a more resilient and diversified export portfolio.
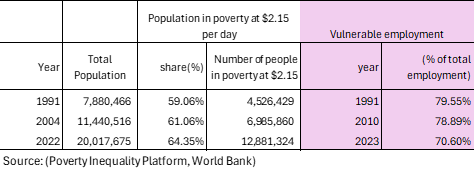
Poverty and vulnerable employment in Zambia
In 2023, a significant 71 percent of Zambia’s total employment was classified as vulnerable employment, underscoring the harsh realities that many individuals confront daily. Vulnerable employment is characterized by inadequate job security, low wages, and a notable absence of critical social protections such as health insurance, pensions, or labor rights. This category primarily encompasses own-account workers who are self-employed without any workers under them, including street vendors and small-scale farmers, as well as contributing family workers who assist in family-run businesses or farms without receiving formal pay. These positions frequently exist within an informal and precarious framework, rendering workers especially vulnerable to economic shocks, exploitation, and the persistent grip of poverty. The repercussions of such employment extend well beyond just the individuals involved, impacting entire families and communities, thereby fostering enduring cycles of instability and hardship that are exceptionally difficult to break free from.
Understanding poverty level significance at $2.15 per day
In 2022, an alarming 64 percent of the population in Zambia (about 13 million people) lived in poverty at $2.15 per day. The poverty level at $2.15 per day (measured in 2017 purchasing power parity, or PPP) is a key global benchmark used by the World Bank to define extreme poverty in low-income countries. It indicates:
1. Basic Survival Threshold
• People living below $2.15 per day struggle to afford essential needs such as food, clean water, shelter, healthcare, and education.
2. Economic Underdevelopment
• A high percentage of a country’s population living below this threshold suggests low economic productivity, high unemployment, and weak social safety nets.
3. Inequality and Social Vulnerability
• It reflects deep income inequality and a lack of access to opportunities for upward mobility.
• People in this category are more vulnerable to shocks like food price increases, climate disasters, or health crises.
4. Policy Challenges
• Governments need targeted interventions such as social welfare programs, job creation, and improved access to education and healthcare to reduce poverty.
A country's export structure is a reflection of its level of development and productive capacities
The export structure of a country refers to the composition, diversity, and value of the goods and services it sells to other countries. It provides key insights into the country’s economic health, competitiveness, and level of development. Productive capacities of a country refer to its ability to produce goods and services efficiently and sustainably over time. These capacities are shaped by various factors, including human capital, natural resources, infrastructure, private sector, development, technology & innovation, institutions & governance, financial systems trade & market access.
Here’s what the export structure and productive capacities of a country typically indicate:
- Level of Economic Development
- Developed economies usually export high-value manufactured goods, technology, and services.
- Developing economies often rely on raw materials, agricultural products, or low-value manufactured goods.
- Industrial and Sectoral Strengths
- A strong presence of high-tech or industrial goods (e.g., machinery, electronics) suggests a well-developed manufacturing sector.
- A dominance of commodities (e.g., oil, minerals, agricultural products) indicates reliance on natural resources.
- Export Diversification
- A diverse export base (multiple industries) makes a country’s economy more stable and resilient to global price shocks.
- A concentrated export base (few key products) makes it vulnerable to market fluctuations.
- Trade Partnerships and Dependence
- If exports are heavily dependent on a single country or region, the economy is more exposed to geopolitical and trade risks.
- A wide range of trading partners indicates stronger global integration.
- Competitiveness and Value Addition
- Exporting mainly raw materials (e.g., crude oil instead of refined petroleum) suggests limited industrial processing capacity.
- A high share of finished and high-tech goods suggests strong value addition and competitiveness.
Zambia-Sanitation
Zambia – Proportion of population served with at least basic sanitation
In 2022, the proportion of the population served with at least basic sanitation in Zambia was 36.3 %. The proportion of the population served with at least basic sanitation in Zambia increased gradually from 19.9% in 2000 to 36.3 % in 2022, an absolute change of 19.9 percentage points (pp) between 2000 and 2022.
Zambia- Proportion of urban population served with at least basic sanitation
In 2022, the proportion of urban population served with at least basic sanitation for Zambia was 42 %. Proportion of urban population served with at least basic sanitation of Zambia declined gradually from 45.7 % in 2000 to 42 % in 2022 an absolute change of 3.7pp between 2000 and 2022.
Zambia- Proportion of rural population served with at least basic sanitation
In 2022, the proportion of the rural population served with at least basic sanitation in Zambia was 31.5 %. The proportion of the rural population served with at least basic sanitation in Zambia increased from 6.2 % in 2000 to 31.5 % in 2022, an absolute change of 25.3 pp between 2000 and 2022.
Zambia – Proportion of population served with at least basic sanitation
The persistent lack of safe sanitation is a critical humanitarian issue that affects countless lives, leading to preventable deaths without adequate support and resources. This not only represents a significant public health crisis but also highlights that access to safe sanitation is a fundamental human right for all. In 2022, approximately 13 million people, or nearly 64 percent of Zambia’s population, faced inadequate sanitation facilities, a stark contrast to Vietnam, China, and Thailand, where only 8 percent, 5 percent, and 1 percent of populations lacked these vital services. The global average of 6 percent further emphasizes the urgent need for collective action to improve sanitation access in the underserved regions of Sub-Saharan Africa, ensuring everyone can live with dignity and health.

Zambia – Proportion of rural population served with at least basic sanitation
The ongoing lack of safe sanitation is not just a statistic; it signifies a humanitarian crisis affecting millions and demands our urgent action. Each year, countless preventable deaths occur, reminding us that access to safe sanitation is a fundamental human right that must be ensured for all. In 2022, 78 percent of the Zambia’s rural population, about 13 million people, endured significant struggles due to inadequate sanitation, highlighting the stark inequalities in our global community. This urgent issue requires a united effort to improve sanitation access in neglected regions of Sub-Saharan Africa. By collaborating and sharing our resources and expertise, we can drive meaningful change and restore health and dignity to those in need, guaranteeing every individual the sanitation they deserve.

Zambia-Water Supply
Zambia – Proportion of total population served with at least basic water
In 2022, proportion of population served with at least basic water for Zambia was 68.2 %. Proportion of population served with at least basic water of Zambia increased from 47.0 % in 2000 to 68.2 % in 2022 , an absolute change 21.2 pp between 2000 and 2022.
Zambia – Proportion of urban population served with at least basic water
In 2022, the proportion of the urban population served with at least basic water in Zambia was 88.6 %. The proportion of urban population served with at least basic water in Zambia increased from 82.6 % in 2000 to 88.6 % in 2022, an absolute change of 6.0 pp between 2000 and 2022.
Zambia – Proportion of rural population with at least basic water
In 2022, the proportion of the rural population served with at least basic water in Zambia was 51.1%. The proportion of the rural population served with at least basic water in Zambia increased from 28.0 % in 2000 to 51.1 % in 2022, an absolute increase of 23.1 pp between 2000 and 2022.
Zambia- Proportion of population with access to at least basic drinking water
Access to safe drinking water is a fundamental human right that requires urgent action from all of us. In 2022, about 6.5 million people in Zambia, or 32% of the population, faced severe challenges in accessing this essential resource, highlighting a significant public health crisis that needs our attention. In contrast, countries like Thailand have universal access to safe drinking water, while 98% of people in Vietnam and Bangladesh have reliable sources. This stark inequality underscores the pressing need for reforms in Sub-Saharan Africa, where many still lack the basic water services vital for health and dignity. We must intensify our collective efforts to ensure that everyone can access safe drinking water, embracing our shared responsibility to address this critical issue.

Zambia- Proportion of rural population with access to at least basic drinking water
In 2022, it is alarming that 49 percent of Zambia’s rural population, around 5 million people, lacked access to safe drinking water, highlighting a critical humanitarian crisis that urgently needs our urgent attention. In contrast, Thailand, Bangladesh, and Vietnam enjoy nearly universal access to this essential resource, with their rural populations accessing safe drinking water at rates of 100 percent, 98 percent, and 97 percent respectively. This stark contrast not only reflects the governance challenges facing many Sub-Saharan African nations but also underscores the need for unified efforts to improve living conditions and ensure essential resources for vulnerable communities affected by these disparities. Tackling this issue is crucial for the health of these populations and for advancing sustainable development and reducing inequalities in the region.

Zambia-Access to Electricity
Zambia- Access to electricity (% of population)
In 2022, the proportion of the population with access to electricity in Zambia was 47.8 %. The proportion of the population with access to electricity of Zambia increased from 16.7% in 2000 to 47.8% in 2022, an absolute change of 31.1pp between 2000 and 2022.
Zambia- Access to electricity (% urban population)
In 2022, the proportion of the urban population with access to electricity in Zambia was 87%. The proportion of the urban population with access to electricity in Zambia increased from 44.1 % in 2000 to 87% in 2022, an absolute change of 42.9 pp between 2000 and 2022.
Zambia- Access to electricity (% of rural population)
In 2022, the proportion of the rural population with access to electricity in Zambia was 14.5 %. The proportion of the rural population with access to electricity in Zambia increased from 2.1 % in 2000 to 14.5% in 2022, an absolute change of 12.4 pp between 2000 and 2022.
Zambia- Proportion of population with access to electricity: A Global Perspective: A Global Perspective
In 2022, nearly 52 percent of Zambia’s population lived without electricity, reflecting a critical crisis impacting over 10.7 million individuals reliant on this vital service for their daily activities. This situation highlights the urgent need for transformative strategies across Sub-Saharan Africa. Learning from the successes of countries like Vietnam, Thailand, Sri Lanka, and Malaysia, which have achieved universal electricity access, we can collaborate to address the challenge of reliable electricity supply. Addressing this issue goes beyond alleviating inconvenience; it is about creating pathways for better development, health, education, and economic opportunities, all essential for improving living standards and fostering a sustainable future that empowers Zambian communities and contributes to a more equitable society for all.

Zambia- Proportion of rural population with access to electricity: A Global Perspective
In 2022, a staggering 85 percent of the rural population in Zambia, nearly 9 million people, lived without electricity, starkly contrasting with countries like Vietnam, Thailand, and Sri Lanka, where rural residents enjoy full access to this essential resource. Even in developing nations such as India and Bangladesh, an impressive 99 percent of rural populations benefit from reliable electricity. These figures highlight the urgent need for meaningful governance reforms across Sub-Saharan Africa to ensure that every community has dependable access to electricity and is empowered to thrive, paving the way for a sustainable and prosperous future.

Zambia: Health outcomes
Zambia-Life Expectancy: A Global Perspective
As we explore the life expectancy trends of the past seventy years, it is apparent that while humanity has made remarkable strides towards longer and healthier lives, significant disparities persist, particularly in Sub-Saharan Africa. The global average life expectancy for newborns has surged from 47 years in 1950 to 71 years by 2021, yet many Sub-Saharan nations, like Zambia, have seen only limited improvements, with life expectancy rising from 49 years in 1960 to 62 years in 2022. In contrast, countries such as South Korea and the Maldives have achieved impressive gains, with life expectancy jumping from 54 years in 1960 to 83 years in 2022 and from 39 years in 1960 to 81 years in 2022, respectively. The ongoing low life expectancy in various Sub-Saharan African countries highlights acute issues such as poverty, inadequate healthcare, and governance challenges, emphasizing the urgent need for collaborative and transformative efforts to create a sustainable and equitable future for these communities.

Zambia-Mortality rate, under-5 (per 1,000 live births): A Global Perspective
Zambia has seen significant changes in under-five mortality rates since 1950, primarily due to improvements in living conditions, healthcare access, nutrition, and clean drinking water. While wealthy nations in Europe and North America have lowered their childhood mortality rates to below four percent thanks to strong healthcare systems, many developing countries in South America, Asia, and Africa have made notable strides in recent decades. However, progress remains uneven in Sub-Saharan Africa. For instance, Zambia reduced its under-five mortality rate from 156 per 1,000 live births in 1980 to 56 in 2022, while Bangladesh and India achieved notable declines from 206 and 169 to just 29. These statistics highlight ongoing challenges in healthcare systems and emphasize the urgent need for governance reforms to address child mortality and improve health outcomes for vulnerable populations, reinforcing the importance of international collaboration and investment in sustainable health initiatives.

Zambia-Maternal mortality ratio (per 100,000 live births): A Global Perspective
Zambia’s maternal mortality ratio declined from 419 in 2000 to 135 in 2020, revealing significant challenges for mothers nationwide. This troubling trend contrasts sharply with improvements in countries like Bangladesh, India, and Vietnam, which reported maternal mortality rates of 123, 103, and 46 in 2022 respectively. These alarming figures highlight the crisis of pregnancy-related deaths in Zambia, driven by high birth rates and enduring maternal health issues that require urgent action. The data exposes serious deficiencies in the healthcare system in many Sub-Saharan African nations. The stark differences in maternal health outcomes compared to other developing regions stress the critical need for substantial investments in health infrastructure to protect the health and well-being of mothers and their children in Zambia.
