Tanzania
Country Flag Details
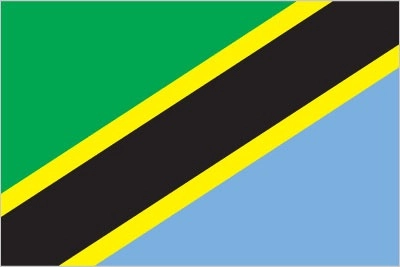
divided diagonally by a yellow-edged black band from the lower hoist-side corner; the upper triangle (hoist side) is green and the lower triangle is blue; the banner combines colors found on the flags of Tanganyika and Zanzibar; green represents the natural vegetation of the country, gold its rich mineral deposits, black the native Swahili people, and blue the country’s many lakes and rivers, as well as the Indian Ocean.
Background
Tanzania fell under German rule during the late 19th century as part of German East Africa. After World War I, Britain governed the mainland as Tanganyika. Shortly after achieving independence from Britain in the early 1960s, Tanganyika and Zanzibar merged to form the United Republic of Tanzania in 1964.
Geography
Area
total : 947,300 sq km
land: 885,800 sq km
water: 61,500 sq km
Climate
varies from tropical along coast to temperate in highlands
Natural resources
hydropower, tin, phosphates, iron ore, coal, diamonds, gemstones (including tanzanite, found only in Tanzania), gold, natural gas, nickel
People and Society
Population
total: 67,462,121
Ethnic groups
mainland – African 99% (of which 95% are Bantu consisting of more than 130 tribes), other 1% (consisting of Asian, European, and Arab); Zanzibar – Arab, African, mixed Arab and African
Languages
Kiswahili or Swahili (official), Kiunguja (name for Swahili in Zanzibar), English (official, primary language of commerce, administration, and higher education), Arabic, many local languages
Religions
Christian 63.1%, Muslim 34.1%, folk religion 1.1%, Buddhist <1%, Hindu <1%, Jewish <1%, other <1%, unspecified 1.6% (2020 est.)
Population growth rate
2.72% (2024 est.)
Government
Government type
presidential republic
Executive branch
chief of state: President Samia Suluhu HASSAN (since 19 March 2021)
head of government: President Samia Suluhu HASSAN (since 19 March 2021)
Economy
Economic overview
emerging lower middle-income East African economy; resource-rich and growing tourism; strong post-pandemic recovery from hospitality, electricity, mining, and transit sectors; declining poverty; stable inflation; gender-based violence economic and labor force disruptions
Real GDP (purchasing power parity)
$233.786 billion (2023 est.)
$222.506 billion (2022 est.)
$212.79 billion (2021 est.)
Real GDP per capita
$3,600 (2023 est.)
$3,500 (2022 est.)
$3,500 (2021 est.)
Exports
$13.98 billion (2023 est.)
$11.986 billion (2022 est.)
$9.874 billion (2021 est.)
Exports – partners
India 15%, UAE 14%, Uganda 12%, South Africa 10%, China 6% (2023)
Exports – commodities
gold, refined petroleum, dried legumes, refined copper, coal (2023)
Imports
$16.059 billion (2023 est.)
$16.674 billion (2022 est.)
$11.61 billion (2021 est.)
Imports – partners
China 32%, India 13%, UAE 9%, Saudi Arabia 5%, Japan 4% (2023)
Imports – commodities
refined petroleum, plastics, garments, fertilizers, wheat (2023)
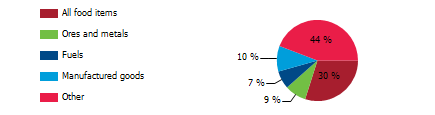
Export structure by product group in 2023 (% of total exports) (UNCTAD)
The export structure of a nation reflects the variety, composition, and valuation of its internationally traded goods and services, providing critical insights into its economic health, competitive positioning, and stage of development. In Tanzania, this export landscape is defined by a rich mix of mineral resources, with gold standing out as a particularly significant contributor, complemented by a range of agricultural products and a nascent manufacturing sector. Ongoing initiatives aimed at diversifying export offerings and enhancing the value of primary commodities are expected to strengthen economic resilience and facilitate sustainable growth, ultimately fostering a more robust and dynamic economic environment for the nation.
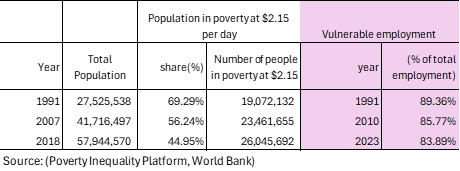
Poverty and vulnerable employment in Tanzania
In 2023, an alarming 84 percent of Tanzania’s total employment was categorized as vulnerable employment, which is characterized by inadequate job security, low wages, and a lack of essential social protections, including health insurance, pensions, and labor rights. This category primarily consists of Own-Account Workers—individuals who operate independently without employees, such as street vendors and small-scale farmers—and Contributing Family Workers, who assist in family businesses or farms without receiving formal compensation. Jobs within this framework are often informal and unstable, lacking crucial benefits, which increases the vulnerability of workers to economic fluctuations, exploitation, and poverty. The ramifications of vulnerable employment reach far beyond the individual, influencing families and communities by perpetuating cycles of instability and hardship that are difficult to escape.
Understanding poverty level significance at $2.15 per day
In 2018, 45 percent of the population in Tanzania ( 26 million people) lived in poverty at $2.15 per day. The poverty level at $2.15 per day (measured in 2017 purchasing power parity, or PPP) is a key global benchmark used by the World Bank to define extreme poverty in low-income countries. It indicates:
1. Basic Survival Threshold
• People living below $2.15 per day struggle to afford essential needs such as food, clean water, shelter, healthcare, and education.
2. Economic Underdevelopment
• A high percentage of a country’s population living below this threshold suggests low economic productivity, high unemployment, and weak social safety nets.
3. Inequality and Social Vulnerability
• It reflects deep income inequality and a lack of access to opportunities for upward mobility.
• People in this category are more vulnerable to shocks like food price increases, climate disasters, or health crises.
4. Policy Challenges
• Governments need targeted interventions such as social welfare programs, job creation, and improved access to education and healthcare to reduce poverty.
A country's export structure is a reflection of its level of development and productive capacities
The export structure of a country refers to the composition, diversity, and value of the goods and services it sells to other countries. It provides key insights into the country’s economic health, competitiveness, and level of development. Productive capacities of a country refer to its ability to produce goods and services efficiently and sustainably over time. These capacities are shaped by various factors, including human capital, natural resources, infrastructure, private sector, development, technology & innovation, institutions & governance, financial systems trade & market access.
Here’s what the export structure and productive capacities of a country typically indicate:
- Level of Economic Development
- Developed economies usually export high-value manufactured goods, technology, and services.
- Developing economies often rely on raw materials, agricultural products, or low-value manufactured goods.
- Industrial and Sectoral Strengths
- A strong presence of high-tech or industrial goods (e.g., machinery, electronics) suggests a well-developed manufacturing sector.
- A dominance of commodities (e.g., oil, minerals, agricultural products) indicates reliance on natural resources.
- Export Diversification
- A diverse export base (multiple industries) makes a country’s economy more stable and resilient to global price shocks.
- A concentrated export base (few key products) makes it vulnerable to market fluctuations.
- Trade Partnerships and Dependence
- If exports are heavily dependent on a single country or region, the economy is more exposed to geopolitical and trade risks.
- A wide range of trading partners indicates stronger global integration.
- Competitiveness and Value Addition
- Exporting mainly raw materials (e.g., crude oil instead of refined petroleum) suggests limited industrial processing capacity.
- A high share of finished and high-tech goods suggests strong value addition and competitiveness.
Tanzania-Sanitation
Tanzania – Proportion of population served with at least basic sanitation
Proportion of population served with at least basic sanitation of United Republic of Tanzania was 30.6.Proportion of population served with at least basic sanitation of Tanzania increased from 6.5 % in 2000 to 30.6 % in 2022 an absolute change of 24.1 percentage points(pp) between 2000 and 2022.
Tanzania- Proportion of urban population served with at least basic sanitation
In 2022, proportion of urban population served with at least basic sanitation for Tanzania was 46.8 %. Proportion of urban population served with at least basic sanitation of Tanzania increased gradually from 12.1 % in 2000 to 46.8 % in 2022 an absolute change of 34.7 pp between 2000 and 2022.
Tanzania – Proportion of rural population served with at least basic sanitation
In 2022, proportion of rural population served with at least basic sanitation for Tanzania was 21.3 %. Proportion of rural population served with at least basic sanitation of Tanzania increased from 4.8 % in 2000 to 21.3 % in 2022 an absolute change of 16.5 pp between 2000 and 2022.
Tanzania – Proportion of population served with at least basic sanitation: A Global Perspective
The ongoing lack of safe sanitation is a significant challenge that requires urgent action, leading to preventable deaths for hundreds of thousands annually and revealing a serious public health crisis. Access to safe sanitation is a fundamental human right that must be guaranteed for all. In 2022, approximately 46 million people, nearly 69 percent of Tanzania’s population, suffered the harsh effects of inadequate sanitation, in stark contrast to Vietnam, China, and Thailand, where only 8 percent, 5 percent, and 1 percent respectively faced similar issues. With a global average of about 6 percent lacking proper sanitation, the urgency to enhance access in underserved regions of Sub-Saharan Africa is paramount. We must unite to address this crisis, ensuring every individual has the dignity and safety that comes with adequate sanitation, essential for public health and sustainable community development.

Tanzania – Proportion of rural population served with at least basic sanitation: A Global Perspective
In 2022, nearly 33 million individuals living in rural Tanzania, which represented around 80 percent of this population, were without access to basic sanitation services, highlighting a shocking disparity compared to countries like Vietnam, Sri Lanka, and Thailand, where the figures stood at significantly lower rates of 12 percent, 5 percent, and 2 percent respectively. This lack of safe sanitation is not merely a pressing issue; it is a profoundly disturbing reality that demands our immediate and united response, as it results in the preventable loss of countless lives each year and intensifies a public health crisis that calls for urgent action. Safe sanitation is not just a basic necessity; it is a fundamental human right that everyone deserves. We must come together in solidarity to advocate for this critical right throughout Sub-Saharan Africa.

Tanzania-Water Supply
Tanzania – Proportion of total population served with at least basic water
In 2022, the % of the population served with at least basic water in Tanzania was 60.8 %. The proportion of the population served with at least basic drinking water in Tanzania increased from 28.7 % in 2000 to 60.8 % in 2022, an absolute change of 32.1 pp between 2000 and 2022.
Tanzania – Proportion of urban population served with at least basic water
In 2022, the % of the urban population served with at least basic water in Tanzania was 81.1 %. The proportion of urban population served with at least basic water in Tanzania increased from 68.9 % in 2000 to 81.1 % in 2022, an absolute change of 12.2 pp between 2000 and 2022.
Tanzania – Proportion of rural population with at least basic water
In 2022, the proportion of the rural population served with at least basic water in Tanzania was 49.0 %. The proportion of the rural population served with at least basic water in Tanzania increased from 17.1 % in 2000 to 49.0 % in 2022, an absolute change of 31.9 pp between 2000 and 2022.
Tanzania- Proportion of population served with at least basic drinking water: A Global Perspective
Access to safe drinking water is a fundamental human right. In 2022, almost 26 million people in Tanzania, around 39% of the population, lacked this essential resource, revealing a serious public health crisis that demands our attention. In contrast, everyone in Thailand and 98% of individuals in Vietnam and Bangladesh had reliable access that year. This stark disparity emphasizes the urgent need for transformative reforms in Sub-Saharan Africa, where many still lack the resources to improve their quality of life. We must strengthen our efforts to bridge this gap and ensure that everyone has access to safe drinking water, as addressing this issue is a shared ethical responsibility of our global community committed to sustainability and justice.

Tanzania- Proportion of rural population served with at least basic drinking water: A Global Perspective
In 2022, we faced a troubling reality where 51 percent of Tanzania’s rural population, about 21 million people, lacked access to safe drinking water, highlighting a pressing humanitarian crisis that requires our urgent compassion and collective action. In contrast, countries like Thailand, Bangladesh, and Vietnam have successfully provided safe drinking water to 100 percent, 98 percent, and 97 percent of their rural populations, respectively. This alarming gap reflects the governance challenges many Sub-Saharan African nations face and emphasizes the critical need for collaborative efforts to improve living conditions and ensure that vulnerable communities access essential resources for their health and well-being.

Tanzania-Access to Electricity
Tanzania- Access to electricity (% of population)
In 2022, the proportion of the population with access to electricity in Tanzania was 45.8 % 2022. Tanzania’s population with access to electricity increased from 8.7% in 2000 to 45.8% in 2022, an absolute change of 37.1 pp between 2000 and 2022.
Tanzania- Access to electricity (% urban population)
In 2022, the proportion of the urban population with access to electricity in Tanzania was 74.7%. Tanzania’s urban population with access to electricity increased from 32.7% % in 2000 to 74.7% in 2022, an absolute change of 42 pp between 2000 and 2022.
Tanzania- Access to electricity (% of rural population)
In 2022, the proportion of the rural population with access to electricity in Tanzania was 36 %. The proportion of the rural population with access to electricity in Tanzania increased from 1.7 % in 2000 to 36% in 2022, an absolute change of 34.3 pp between 2000 and 2022.
Tanzania-Proportion of population with access to electricity (% of rural population)
In 2022, nearly 54 percent of Tanzania’s population lacked electricity, affecting over 37 million people. This situation starkly contrasts with countries like Vietnam and Malaysia, which have achieved universal electricity access, demonstrating the urgent need for systemic reforms across Sub-Saharan Africa to improve quality of life. The absence of reliable electricity poses serious barriers to development, health, education, and economic opportunities, all crucial for enhancing living standards and fostering a sustainable future. Unified action is needed to promote solutions that ensure electricity access for all, driving progress and prosperity in the region.

Tanzania- Proportion of rural population with access to electricity (% of rural population)
In 2022, a staggering 64 percent of Tanzania’s rural population, nearly 27 million people, lived without electricity, revealing a significant disparity compared to countries like Vietnam, Thailand, and Sri Lanka, where all rural residents have access to this vital resource. Even nations like India and Bangladesh boast that 99 percent of their rural populations enjoy reliable electricity. These figures highlight the urgent need for transformative governance reforms across Sub-Saharan Africa, ensuring every community gains dependable electricity access and the opportunity to pursue a sustainable and prosperous future.

Tanzania: Health outcomes
Tanzania-Life expectancy: A Global Perspective
Tanzania’s life expectancy shows both progress and ongoing challenges, highlighting the urgent need for action. Over the past seventy years, the global average life expectancy has risen from 47 years in 1950 to 71 years in 2021, yet many Sub-Saharan African countries, including Tanzania, continue to face difficulties. Since 1960, Tanzania’s life expectancy has increased from 43 to 67 years by 2022, reflecting the strength of its people despite ongoing struggles. Meanwhile, countries like South Korea and the Maldives have achieved remarkable improvements, with South Korea’s life expectancy rising from 54 years in 1960 to 83 years in 2022 and the Maldives increasing from 39 years in 1960 to 81 years in 2022. The low life expectancy in several Sub-Saharan African nations serves as a stark reminder of the complex issues they encounter, such as poverty and insufficient healthcare, underlining the urgent need for united efforts towards a fair and sustainable future.

Tanzania-Mortality rate, under-5 (per 1,000 live births): A Global Perspective
Since 1950, child mortality rates globally have significantly declined due to improvements in living conditions, healthcare access, nutrition, and safe drinking water. In wealthy nations, child mortality has fallen below four percent, showcasing the effectiveness of strong healthcare systems. Conversely, progress in Sub-Saharan Africa, including Tanzania, has been slow; Tanzania’s under-five mortality rate has decreased from 179 in 1980 to 41 in 2022. In comparison, Bangladesh and India have achieved remarkable reductions in their rates. This highlights the pressing challenges posed by weak healthcare systems and the urgent need for reforms in governance across Sub-Saharan Africa, underscoring the vital role of international collaboration and investment in needed reforms in Sub-Saharan Africa.

Tanzania-Maternal mortality ratio (per 100,000 live births): A Global Perspective
Tanzania has made important progress in lowering its maternal mortality ratio from 760 in 2000 to 238 in 2020, but this number is still far too high, revealing the ongoing difficulties mothers encounter throughout the country. While this improvement is noteworthy, it is significantly higher than the much lower ratios of 123, 103, and 46 seen in Bangladesh, India, and Vietnam in 2022. The situation is worsened by high birth rates and ongoing maternal health problems that require immediate action. These concerning figures expose serious flaws in the healthcare system and chronic underfunding that affect Sub-Saharan Africa. The differences in maternal health outcomes, particularly when compared to other developing regions, stress the urgent need for major investments in healthcare infrastructure and resources to ensure the safety and well-being of mothers and their children in Tanzania.
