Rwanda
Country Flag Details
three horizontal bands of sky blue (top, double width), yellow, and green, with a golden sun with 24 rays near the fly end of the blue band; blue represents happiness and peace, yellow economic development and mineral wealth, green hope of prosperity and natural resources; the sun symbolizes unity, as well as enlightenment and transparency from ignorance.
Background
A Rwandan kingdom dominated the Great Lakes region from the mid-18th century onward, with Tutsi rulers conquering others militarily and centralizing power. German colonial conquest began in the late 1890s, but the territory was ceded to Belgian forces in 1916 during World War I. Rwandan independence came in 1962. Conflict between Tutsi and Hutu ethnic groups continued for decades, including genocide in 1994. Rwanda held its first local elections in 1999 and its first presidential and legislative elections in 2003.

Geography
Area
total : 26,338 sq km
land: 24,668 sq km
water: 1,670 sq km
Climate
temperate; two rainy seasons (February to April, November to January); mild in mountains with frost and snow possible
Natural resources
gold, cassiterite (tin ore), wolframite (tungsten ore), methane, hydropower, arable land
People and Society
Population
total: 13,623,302
Ethnic groups
Hutu, Tutsi, Twa
Languages
Kinyarwanda (official, universal Bantu vernacular) 93.2%, French (official) <0.1%, English (official) <0.1%, Swahili/Kiswahili (official, used in commercial centers) <0.1%, more than one language, other 6.3%, unspecified 0.3% (2002 est.)
Religions
Christian 95.9% (Protestant 57.7% [includes Adventist 12.6%], Roman Catholic 38.2%), Muslim 2.1%, other 1% (includes traditional, Jehovah’s Witness), none 1.1% (2019-20 est.)
Population growth rate
1.62% (2024 est.)
Government
Government type
presidential republic
Capital name: Kigali
Executive branch
chief of state: President Paul KAGAME (since 22 April 2000)
head of government: Prime Minister Edouard NGIRENTE (since 30 August 2017)
Economy
Economic overview
fast-growing Sub-Saharan economy; major public investments; trade and tourism hit hard by COVID-19; increasing poverty after 2 decades of declines; Ugandan competition for regional influence; major coffee exporter; contested GDP figures
Real GDP (purchasing power parity)
$42.701 billion (2023 est.)
$39.45 billion (2022 est.)
$36.474 billion (2021 est.)
Real GDP per capita
$3,100 (2023 est.)
$2,900 (2022 est.)
$2,700 (2021 est.)
Exports
$3.509 billion (2023 est.)
$2.993 billion (2022 est.)
$2.11 billion (2021 est.)
Exports – partners
UAE 66%, China 10%, USA 3%, Kenya 3%, Thailand 2% (2023)
Exports – commodities
gold, rare earth ores, coffee, tea, tin ores (2023)
Imports
$5.783 billion (2023 est.)
$4.978 billion (2022 est.)
$3.856 billion (2021 est.)
Imports – partners
China 19%, Kenya 14%, Uganda 13%, Tanzania 9%, UAE 7% (2023)
Imports – commodities
broadcasting equipment, fish, corn, packaged medicine, plastic products (2023)
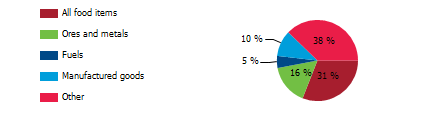
Export structure by product group in 2023 (% of total exports)
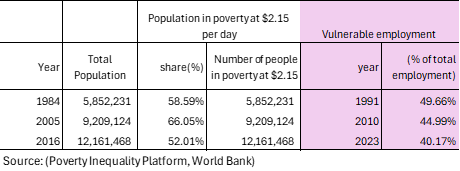
Poverty and vulnerable employment in Rwanda
In 2023, it was observed that 40 percent of Rwanda’s total employment was categorized as vulnerable employment, a concept defined by its association with inadequate job security, meager wages, and the absence of essential social protections such as health insurance, pension plans, and labor rights. This classification primarily encompasses two groups: own-account workers, who are individuals operating independently without employees—such as street vendors and small-scale farmers—and contributing family workers, who engage in family businesses or farms without formal remuneration. These forms of employment are frequently characterized by informality and instability, which render workers particularly vulnerable to economic fluctuations, exploitation, and the dire consequences of poverty. The ramifications of this employment status extend well beyond the individual, influencing families and communities adversely and perpetuating cycles of instability and hardship that are difficult to transcend.
Understanding poverty level significance at $2.15 per day
In 2016, 52 percent of the population in Rwanda lived in poverty at $ 2.15 per day. The poverty level at $2.15 per day (measured in 2017 purchasing power parity, or PPP) is a key global benchmark used by the World Bank to define extreme poverty in low-income countries. It indicates:
1. Basic Survival Threshold
• People living below $2.15 per day struggle to afford essential needs such as food, clean water, shelter, healthcare, and education.
2. Economic Underdevelopment
• A high percentage of a country’s population living below this threshold suggests low economic productivity, high unemployment, and weak social safety nets.
3. Inequality and Social Vulnerability
• It reflects deep income inequality and a lack of access to opportunities for upward mobility.
• People in this category are more vulnerable to shocks like food price increases, climate disasters, or health crises.
4. Policy Challenges
• Governments need targeted interventions such as social welfare programs, job creation, and improved access to education and healthcare to reduce poverty.
A country's export structure is a reflection of its level of development and productive capacities
The export structure of a country refers to the composition, diversity, and value of the goods and services it sells to other countries. It provides key insights into the country’s economic health, competitiveness, and level of development. Productive capacities of a country refer to its ability to produce goods and services efficiently and sustainably over time. These capacities are shaped by various factors, including human capital, natural resources, infrastructure, private sector, development, technology & innovation, institutions & governance, financial systems trade & market access.
Here’s what the export structure and productive capacities of a country typically indicate:
- Level of Economic Development
- Developed economies usually export high-value manufactured goods, technology, and services.
- Developing economies often rely on raw materials, agricultural products, or low-value manufactured goods.
- Industrial and Sectoral Strengths
- A strong presence of high-tech or industrial goods (e.g., machinery, electronics) suggests a well-developed manufacturing sector.
- A dominance of commodities (e.g., oil, minerals, agricultural products) indicates reliance on natural resources.
- Export Diversification
- A diverse export base (multiple industries) makes a country’s economy more stable and resilient to global price shocks.
- A concentrated export base (few key products) makes it vulnerable to market fluctuations.
- Trade Partnerships and Dependence
- If exports are heavily dependent on a single country or region, the economy is more exposed to geopolitical and trade risks.
- A wide range of trading partners indicates stronger global integration.
- Competitiveness and Value Addition
- Exporting mainly raw materials (e.g., crude oil instead of refined petroleum) suggests limited industrial processing capacity.
- A high share of finished and high-tech goods suggests strong value addition and competitiveness.
Rwanda-Sanitation
Rwanda – Proportion of population served with at least basic sanitation
In 2022, proportion of population served with at least basic sanitation for Rwanda was 73.8 %. Proportion of population served with at least basic sanitation of Rwanda increased from 44.9 % in 2000 to 73.8 % in 2022 an absolute change of 28.9 percentage points (pp) between 2000 and 2022.
Rwanda – Proportion of urban population served with at least basic sanitation
In 2022, proportion of urban population served with at least basic sanitation for Rwanda was 53.6 %. Proportion of urban population served with at least basic sanitation of Rwanda fell gradually from 61.9 % in 2000 to 53.6 % in 2022 an absolute change of 8.3 pp between 2000 and 2022.
Rwanda – Proportion of rural population served with at least basic sanitation
In 2022, proportion of rural population served with at least basic sanitation for Rwanda was 78.2 %. Proportion of rural population served with at least basic sanitation of Rwanda increased from 41.9 % in 2000 to 78.2 % in 2022 an absolute change of 36.3 pp between 2000 and 2022.
Rwanda – Proportion of population served with at least basic sanitation: A Global Perspective
A lack of safe sanitation in Rwanda is a pressing crisis requiring immediate action. Access to safe sanitation is a fundamental human right that should be universally guaranteed. In 2022, approximately 4 million people, or 26 percent of Rwanda’s population, experienced the detrimental effects of inadequate sanitation facilities, a stark contrast to countries like Vietnam, China, and Thailand, where only 8 percent, 5 percent, and 1 percent respectively lack these essential services. The global average of individuals without proper sanitation is around 6 percent, highlighting the urgent need for focused efforts to improve sanitation access in Sub-Saharan Africa, where the consequences of poor sanitation are most severe and hinder progress toward sustainable development.

Rwanda – Proportion of rural population not served with at least basic sanitation: A Global Perspective
In 2022 nearly 3 million people in rural Rwanda about 22 percent of the this population lacked access to basic sanitation facilities highlighting a significant disparity compared to countries like Vietnam, Sri Lanka, and Thailand, where the figures were much lower at 12 percent, 5 percent, and 2 percent, respectively. The lack of safe sanitation is a critical issue that demands urgent attention as it leads to preventable deaths and worsens a public health crisis. Safe sanitation is not just a necessity but a fundamental human right that every individual deserves We must unite to advocate for this essential right across Sub-Saharan Africa where the urgency is clear and the potential for meaningful community change is vital for the dignity and well-being of all.

Rwanda-Water Supply
Rwanda- Proportion of total population served with at least basic water
In 2022, proportion of population served with at least basic water for Rwanda was 65.1 %. Proportion of population served with at least basic water of Rwanda increased from 44.5 % in 2000 to 65.1 % in 2022 an absolute change of 20.6 pp between 2000 and 2022.
Rwanda – Proportion of urban population served with at least basic water .
In 2022, proportion of urban population served with at least basic water for Rwanda was 88.1 %. Proportion of urban population served with at least basic water of Rwanda increased from 69.9 % in 2000 to 88.1 % in 2022 an absolute change of 18.2 pp between 2000 and 2022.
Rwanda – Proportion of rural population with at least basic water
In 2022, proportion of rural population served with at least basic water for Rwanda was 60.1 %. Proportion of rural population served with at least basic water of Rwanda increased from 40.0% in 2000 to 60.1 % in 2022 an absolute change of 20.1 pp between 2000 and 2022.
Rwanda- Proportion of population served with at least basic drinking water: A Global Perspective
In 2022, nearly 5 million people, or about 35% of the population, lacked this essential resource, highlighting a pressing public health crisis. In comparison, everyone in Thailand and 98% of individuals in Vietnam and Bangladesh had access to safe drinking water that year. This stark inequality reveals the urgent need for transformative changes in Sub-Saharan Africa, the only developing region where many still lack access to basic resources for improved living conditions. We must unite our efforts to close this gap, ensuring that everyone can obtain the safe drinking water they deserve, as this challenge reflects a profound moral obligation we share as a global community.

Rwanda- Proportion of rural population served with at least basic drinking water: A Global Perspective
In 2022, 40 percent of Rwanda’s rural population, around 5 million people, still lacked access to safe drinking water, highlighting a critical humanitarian crisis. In contrast, countries like Thailand, Bangladesh, and Vietnam have achieved near-universal access, with 100 percent, 98 percent, and 97 percent of their rural populations benefiting from this essential resource. This stark disparity underscores significant governance challenges in many Sub-Saharan African nations and demands coordinated efforts to improve living conditions and ensure vulnerable communities obtain the resources vital for their survival and well-being.

Rwanda-Access to Electricity
Rwanda-Access to electricity (% of population)
In 2022, proportion of population with access to electricity for Rwanda was 50.6 %. The proportion of population with access to electricity of Burundi increased from 6.2% in 2000 to 50.6% in 2022, an absolute change of 44.4 pp between 2000 and 2022.
Rwanda-Access to electricity (% urban population)
In 2022, proportion of urban population with access to electricity for Rwanda was 98%. The proportion of urban population with access to electricity of Rwanda increased from 38.9% % in 2000 to 98% in 2022, an absolute change of 59.1 pp between 2000 and 2022.
Rwanda-Access to electricity (% of rural population)
In 2022, the proportion of the rural population with access to electricity for Rwanda was 38.2 %. Proportion of the rural population with access to electricity of Rwanda increased from 2.6 % in 2010 to 38.2% in 2022, an absolute change of 35.6 pp between 2010 and 2022.
Rwanda- Proportion of population served with electricity: A Global Perspective
In 2022, nearly 49 percent of Rwanda’s population lacked electricity, a critical crisis affecting over 7 million people who are denied this essential service. This alarming situation contrasts sharply with nations like Vietnam and Thailand that have achieved universal electricity access, highlighting the urgent need for systemic reforms across Sub-Saharan Africa to enhance quality of life. The absence of reliable electricity hinders development, health, education, and economic opportunities vital for improving living standards and nurturing aspirations for a sustainable future. Immediate action is necessary to ensure everyone has access to dependable electricity, paving the way for a brighter tomorrow.

Rwanda- Proportion of rural population served with electricity: A Global Perspective
In 2022, an alarming 62 percent of Rwanda’s rural population, nearly 7 million people, lived without electricity, revealing a stark contrast to countries like Vietnam, Thailand, and Sri Lanka, where all rural residents have access to this vital resource. In India and Bangladesh, 99 percent of rural populations benefit from reliable electricity. These figures highlight the urgent need for transformative governance reforms across Sub-Saharan Africa. We must advocate for and implement changes that ensure every community has dependable access to electricity, empowering them to thrive and pursue a sustainable and prosperous future.

Rwanda: Health outcomes
Rwanda-Life expectancy: A Global Perspective
Burundi’s life expectancy is a key metric for evaluating health outcomes globally, highlighting an urgent need for action. While the global average life expectancy rose from 47 years in 1950 to 71 years in 2021, many Sub-Saharan African nations, including Rwanda, face stagnation. Rwanda’s life expectancy improved from 47 years in 1960 to 67 years in 2022, reflecting ongoing challenges. In contrast, South Korea’s life expectancy surged from 54 years in 1960 to 83 years in 2022, and the Maldives jumped from 39 years to 81 years in the same period. The persistent low life expectancy in various Sub-Saharan African countries underscores critical issues such as poverty, inadequate healthcare, and governance difficulties, underscoring the necessity for united and empathetic initiatives to achieve a sustainable future where global health progress benefits all.

Rwanda-Mortality rate, under-5 (per 1,000 live births): A Global Perspective
Rwanda’s under-five mortality rate per 1000 live births marks a crucial challenge in global child mortality trends since 1950, reflecting both notable achievements and ongoing struggles linked to living conditions, healthcare access, nutrition, and safe drinking water. While developed nations in Europe and America have reduced child mortality rates to below four percent due to strong healthcare systems, many Sub-Saharan African countries still experience slow progress. Rwanda has notably decreased its under-five mortality rate from 219 in 1980 to 38 in 2022. In contrast, Vietnam, Thailand, China, Sri Lanka, and South Korea recorded rates of 20, 8, 7, 7, and 3 respectively in 2022. These statistics reveal persistent healthcare infrastructure challenges and highlight the urgent need for governance reforms across Sub-Saharan Africa to lower child mortality rates and improve health outcomes for vulnerable populations.

Rwanda-Maternal mortality ratio (per 100,000 live births): A Global Perspective
Rwanda’s maternal mortality ratio has dropped significantly from 1007 in 2000 to 259 in 2020, yet it remains alarmingly high, highlighting the serious challenges mothers face nationwide. While this progress is commendable, it contrasts sharply with lower ratios in countries such as Bangladesh, India, and Vietnam, which reported figures of 123, 103, and 46 in 2022. These concerning statistics reveal ongoing pregnancy-related fatalities in Rwanda, compounded by a high birth rate and persistent maternal health issues that require urgent intervention. The data underscores critical gaps in the healthcare system and the chronic underfunding affecting many Sub-Saharan African nations. The disparities in maternal health outcomes compared to other developing regions emphasize the need for comprehensive action and substantial investments in healthcare infrastructure to protect the lives of mothers and children in Rwanda and to effectively address this preventable crisis.
